Williams %R Indicator
Williams %R is a momentum oscillator that measures the level of the close relative to the highest high over a look-back period, on an inverted scale from 0 to -100.
What is the Williams %R Indicator?
Developed by Larry Williams in the late 1970s, Williams %R is designed to identify overbought and oversold levels, conceptually similar to the Stochastic Oscillator, but with a unique negative scale.
How to Read Williams %R
- -20 to 0: overbought: price is near the top of its recent range
- -80 to -100: oversold: price is near the bottom of its recent range
- Move above -20 from below: a potential decline signal
- Move above -80 from below: a potential rally signal, as price leaves oversold territory
Best Use Cases
- Stock Trading: particularly effective in markets with clear trends, helping identify reversals early.
- Forex Trading: captures short-term fluctuations well in liquid markets.
- Commodity Trading: useful for entries/exits in markets prone to rapid price changes.
- Combining with Other Indicators: pairing with MACD or RSI helps filter out false signals.
How to Automate a Williams %R Strategy on Signals AI (No Code)
You don't need TradingView, PineScript, or a webhook to trade Williams %R signals. Signals AI is AlgoTest's no-code strategy builder. Describe your Williams %R logic in plain English, or build it visually on the Canvas, and it handles backtesting, paper trading, and live execution with your broker.
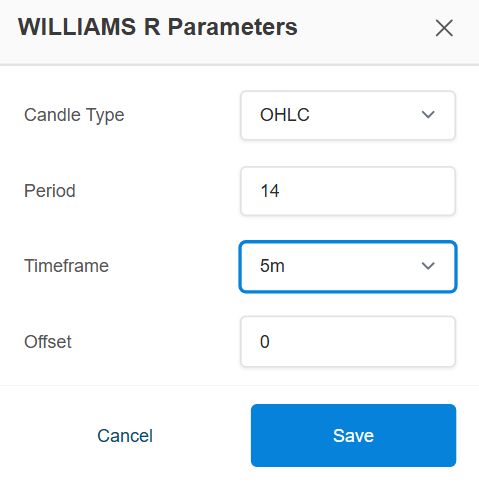
Williams %R parameters on Signals AI:
| Parameter | Default | Description |
|---|---|---|
| period | 14 | Shorter (e.g., 7) = more signals; longer (e.g., 21) = fewer, more reliable |
| candle_type | OHLC | OHLC or HEIKIN_ASHI |
Example strategy: mean reversion
| Condition | |
|---|---|
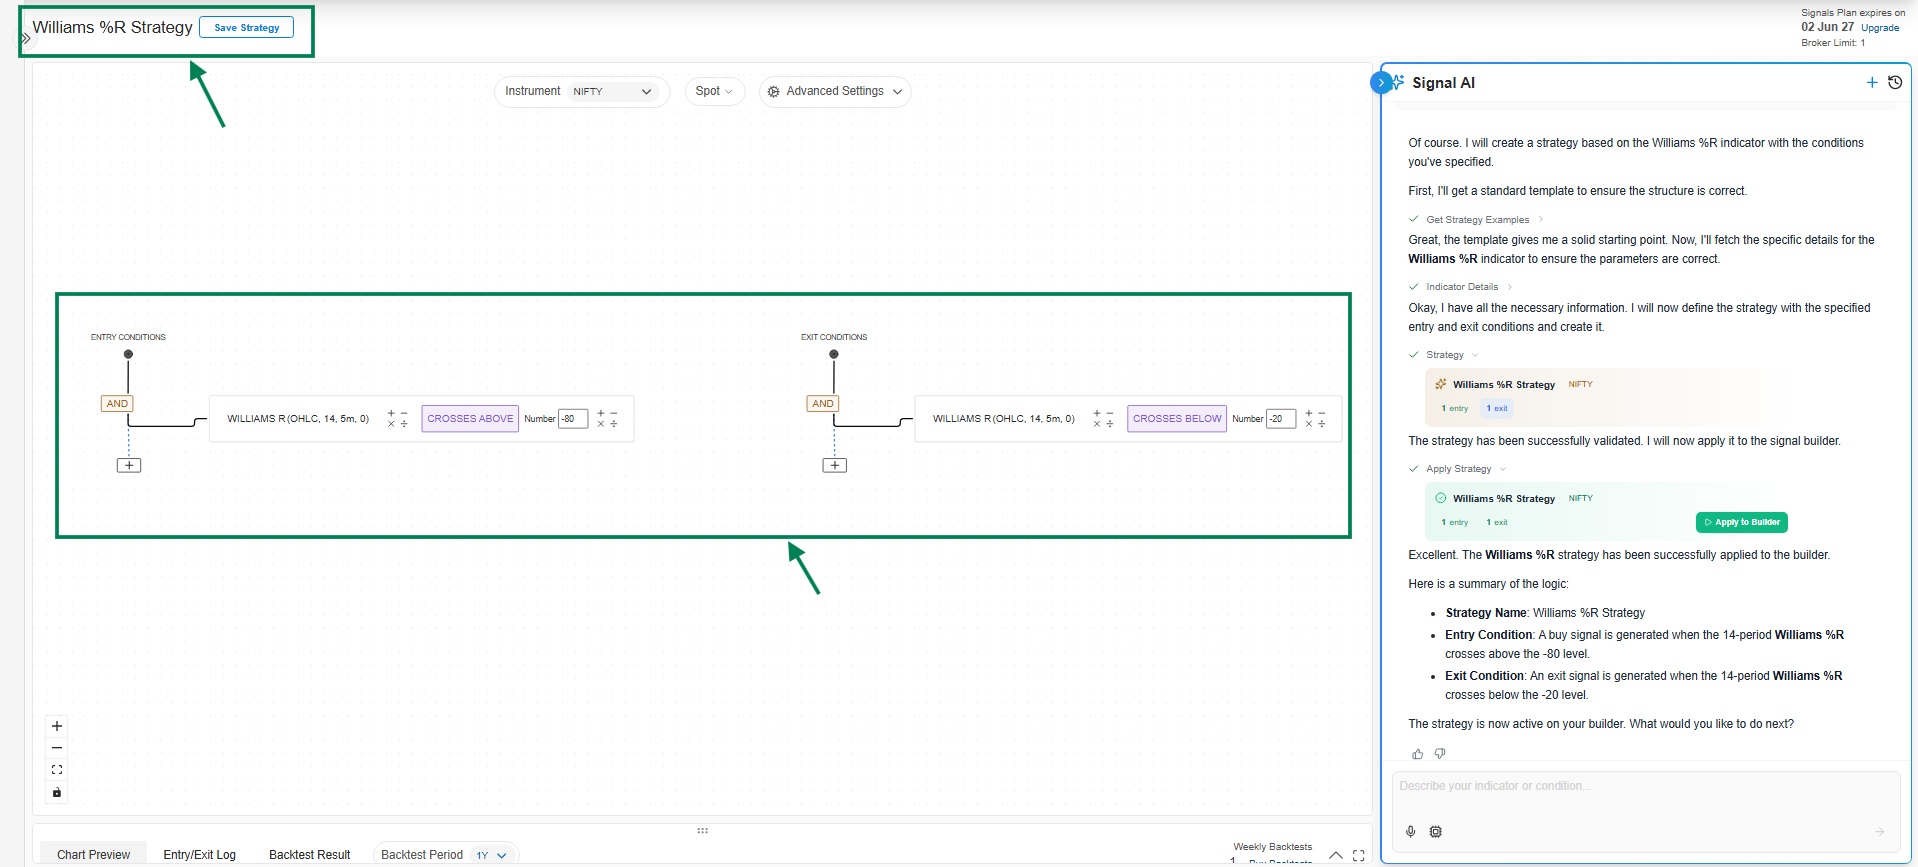
| Entry | Williams %R(14) crosses above -80 (leaving oversold territory) |
| Exit | Williams %R(14) crosses below -20 (leaving overbought territory) |
To build this:
- Open Signals AI and tell the AI Agent something like: "Create a Williams %R strategy on NIFTY 5-minute spot where entry is Williams %R crossing above -80 and exit is Williams %R crossing below -20." Or add a Williams %R Comparison Node manually on the Canvas.
- Preview the signal on the chart to confirm entries line up with real overbought/oversold turns.
- Connect a trade and backtest it on historical data.
- Forward test it with paper money, then go live once you're satisfied.
→ Full click-by-click walkthrough: Quickstart: Your First Signal in 10 Minutes
Williams %R PineScript for TradingView
Prefer TradingView? Here's a ready-to-use Williams %R strategy template. Paste it into the Pine Editor, adjust the length, overbought/oversold levels, target, and stop loss to your preference, and backtest it.
To learn how to add this pinescript in TradingView, click here.
This strategy is for demonstration purposes only and is not intended for actual trading. AlgoTest is not responsible for any profit or loss arising from the use of this sample strategy.
//@version=5
strategy("Williams %R Strategy", overlay=true)

// Input parameters
length = input.int(14, title="Williams %R Length")
overbought_level = input.int(-20, title="Overbought Level")
oversold_level = input.int(-80, title="Oversold Level")
target_points = input.int(100, title="Target Points")
stop_loss_points = input.int(50, title="Stop Loss Points")

// Calculate Williams %R
hh = ta.highest(high, length)
ll = ta.lowest(low, length)
williams_r = (hh - close) / (hh - ll) * -100

// Strategy logic
long_condition = williams_r < oversold_level
short_condition = williams_r > overbought_level

// Plot Williams %R
plot(williams_r, color=color.blue, title="Williams %R")

// Strategy entry
if long_condition
    strategy.entry("Long", strategy.long)
if short_condition
    strategy.entry("Short", strategy.short)

// Calculate target and stop loss levels
long_target = strategy.position_avg_price + target_points
long_stop_loss = strategy.position_avg_price - stop_loss_points
short_target = strategy.position_avg_price - target_points
short_stop_loss = strategy.position_avg_price + stop_loss_points

// Strategy exit
strategy.exit("Long Exit", "Long", limit=long_target, stop=long_stop_loss)
strategy.exit("Short Exit", "Short", limit=short_target, stop=short_stop_loss)
Once you've backtested it on TradingView, you can connect the alert to AlgoTest to automate execution, or skip the PineScript and webhook setup entirely by rebuilding the same logic directly in Signals AI above.
FAQ
Is Williams %R leading or lagging?
Williams %R is considered a lagging indicator as it uses past price data to generate signals.
What is the difference between RSI and Williams %R?
Both are momentum indicators, but while RSI scales from 0 to 100, Williams %R scales inversely from 0 to -100. RSI compares upward movements to downward movements, while Williams %R compares the current close to the highest high of the past.
What is the best setting for the Williams %R indicator?
The typical setting is 14 periods, which can be adjusted based on the trader's analysis timeframe and the asset's volatility.
What is the formula for Williams %R?
The formula for Williams %R is %R = (Highest High − Close) / (Highest High − Lowest Low) × -100.
To automate Williams %R strategies without writing code, visit AlgoTest Signals AI.