Supertrend Indicator
Supertrend is a trend-following indicator built on ATR (volatility). It plots a single line that flips sides when the trend changes, making it one of the most visually simple trend tools available.
What is the Supertrend Indicator?
Supertrend was developed primarily for intraday traders and combines ATR (Average True Range) with median price data to generate buy and sell signals. It's represented as a line that follows price, changing color based on trend direction:
- Below price (typically green) = uptrend
- Above price (typically red) = downtrend
How to Read Supertrend
- Buy Signal: the Supertrend line flips from above price to below price (red to green)
- Sell Signal: the Supertrend line flips from below price to above price (green to red)
- The Period and Multiplier settings control sensitivity: higher multiplier = fewer, more reliable signals; lower = more, noisier signals
Supertrend shines in trending markets but produces false flips in sideways markets. Pair it with a trend strength filter like ADX for confirmation.
Best Use Cases
- Trending Markets: Supertrend excels when a market is clearly trending in one direction.
- Stop-Loss Levels: the line itself provides a clear, volatility-adjusted trailing stop.
- Combining with Other Indicators: pairing with RSI, MACD, or ADX helps confirm trend strength and reduce false flips.
How to Automate a Supertrend Strategy on Signals AI (No Code)
You don't need TradingView, PineScript, or a webhook to trade Supertrend signals. Signals AI is AlgoTest's no-code strategy builder. Describe your Supertrend logic in plain English, or build it visually on the Canvas, and it handles backtesting, paper trading, and live execution with your broker.
Supertrend parameters on Signals AI:
| Parameter | Default | Description |
|---|---|---|
| Period | 10 | ATR lookback period |
| Multiplier | 3 | Distance of the line from price. Higher = fewer, more reliable signals; lower = more, noisier signals |

Example strategy: Supertrend flip (NIFTY spot, 5m)
| Condition | |
|---|---|
| Entry | Close crosses above Supertrend(10, 3) |
| Exit | Close crosses below Supertrend(10, 3) |
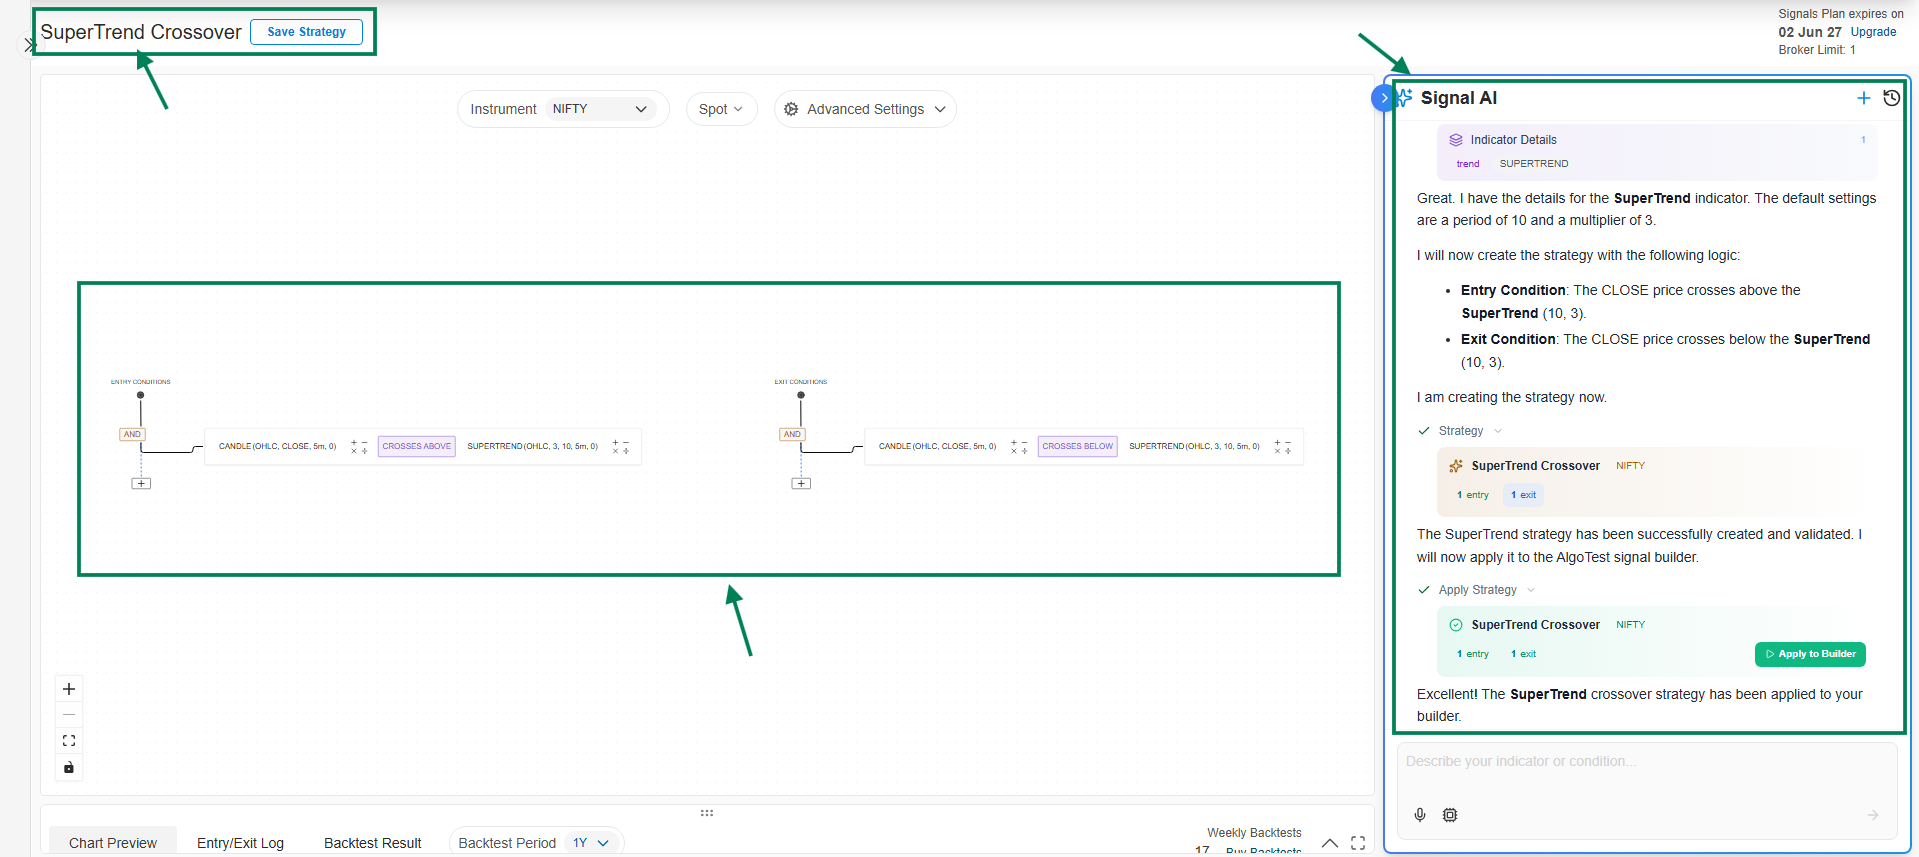
To build this:
- Open Signals AI and tell the AI Agent something like: "Create a Supertrend strategy on NIFTY 5-minute spot with period 10 and multiplier 3, where entry is Close crossing above Supertrend and exit is Close crossing below Supertrend." Or add a Supertrend Comparison Node manually on the Canvas.
- Preview the signal on the chart to check how often the line flips in your chosen instrument and timeframe.
- Connect a trade and backtest it on historical data.
- Forward test it with paper money, then go live once you're satisfied.
→ Full click-by-click walkthrough: Quickstart: Your First Signal in 10 Minutes
Supertrend PineScript for TradingView
Prefer TradingView? Here's a ready-to-use Supertrend strategy template. Paste it into the Pine Editor, adjust the ATR Length, multiplier, target, and stop loss to your preference, and backtest it.
To learn how to add this pinescript in TradingView, click here.
This strategy is for demonstration purposes only and is not intended for actual trading. AlgoTest is not responsible for any profit or loss arising from the use of this sample strategy.
//@version=5
strategy("Supertrend Strategy", overlay=true)

// Input parameters
atr_length = input.int(10, title="ATR Length")
multiplier = input.float(3.0, title="Multiplier")

target_points = input.int(100, title="Target Points")
stop_loss_points = input.int(50, title="Stop Loss Points")

// Calculate ATR and Supertrend
atr = ta.atr(atr_length)
upper_band = hlc3 + (multiplier * atr)
lower_band = hlc3 - (multiplier * atr)
is_uptrend = close > lower_band
is_downtrend = close < upper_band
trend_changed = (is_uptrend[1] and is_downtrend) or (is_downtrend[1] and is_uptrend)

// Strategy logic
long_condition = is_uptrend and trend_changed
short_condition = is_downtrend and trend_changed

// Plot Supertrend
plot(is_uptrend ? lower_band : na, color=color.green, title="Supertrend Up", style=plot.style_linebr)
plot(is_downtrend ? upper_band : na, color=color.red, title="Supertrend Down", style=plot.style_linebr)

// Strategy entry and exit
if long_condition
    strategy.entry("Long", strategy.long)
if short_condition
    strategy.entry("Short", strategy.short)

// Calculate target and stop loss levels
long_target = strategy.position_avg_price + target_points
long_stop_loss = strategy.position_avg_price - stop_loss_points
short_target = strategy.position_avg_price - target_points
short_stop_loss = strategy.position_avg_price + stop_loss_points

// Strategy exit
strategy.exit("Long Exit", "Long", limit=long_target, stop=long_stop_loss)
strategy.exit("Short Exit", "Short", limit=short_target, stop=short_stop_loss)
Once you've backtested it on TradingView, you can connect the alert to AlgoTest to automate execution, or skip the PineScript and webhook setup entirely by rebuilding the same logic directly in Signals AI above.
FAQ
What is a good setting for the Supertrend indicator?
A common setting is 7 for the period and 3 for the multiplier, but these can be adjusted based on the volatility and characteristics of the asset being traded.
What does Supertrend 7 3 mean?
This setting refers to a period of 7 and a multiplier of 3, which helps in determining the sensitivity and the responsiveness of the indicator to price changes.
Is Supertrend a good indicator?
Yes, it is particularly effective in trending markets for identifying direction and optimal entry and exit points.
How effective is Supertrend for intraday trading?
It is highly regarded among intraday traders for its simplicity and effectiveness in trend-based strategies.
Can Supertrend be used for all types of assets?
Yes, it is versatile and can be used across stocks, commodities, forex, and even cryptocurrency markets.
To automate Supertrend strategies without writing code, visit AlgoTest Signals AI.