Stochastic Indicator
The Stochastic Oscillator compares the current closing price to its recent high-low range on a 0–100 scale. The core idea: momentum shifts before price does.
What is the Stochastic Indicator?
Developed in the late 1950s by Dr. George Lane, the Stochastic Oscillator shows the position of the closing price relative to the high-low range over a set number of periods. It has two lines:
- %K: the main line
- %D: a moving average of %K (the signal line)
How to Read Stochastic
- Above 80: overbought
- Below 20: oversold
- %K crosses above %D: potential bullish signal, strongest when both lines are below 20
- %K crosses below %D: potential bearish signal, strongest when both lines are above 80
- Divergence: price and stochastic disagreeing can flag a potential reversal
Best Use Cases
- Trend Reversals: best used in non-trending, range-bound markets with frequent boundaries.
- Overbought/Oversold Conditions: traders look for sell setups above 80 and buy setups below 20.
- Divergence Detection: spotting when price and the oscillator move in opposite directions.
How to Automate a Stochastic Strategy on Signals AI (No Code)
You don't need TradingView, PineScript, or a webhook to trade Stochastic signals. Signals AI is AlgoTest's no-code strategy builder. Describe your Stochastic logic in plain English, or build it visually on the Canvas, and it handles backtesting, paper trading, and live execution with your broker.
Stochastic parameters on Signals AI:
| Parameter | Default | Description |
|---|---|---|
| k_period | 14 | Lookback for %K |
| d_period | 3 | Smoothing for %D |
| stochastic_line | N/A | Which line the condition uses: %K or %D |

Example strategy: %K/%D crossover
| Condition | |
|---|---|
| Entry | %K crosses above %D (strongest when both are below 20) |
| Exit | %K crosses below %D (strongest when both are above 80) |
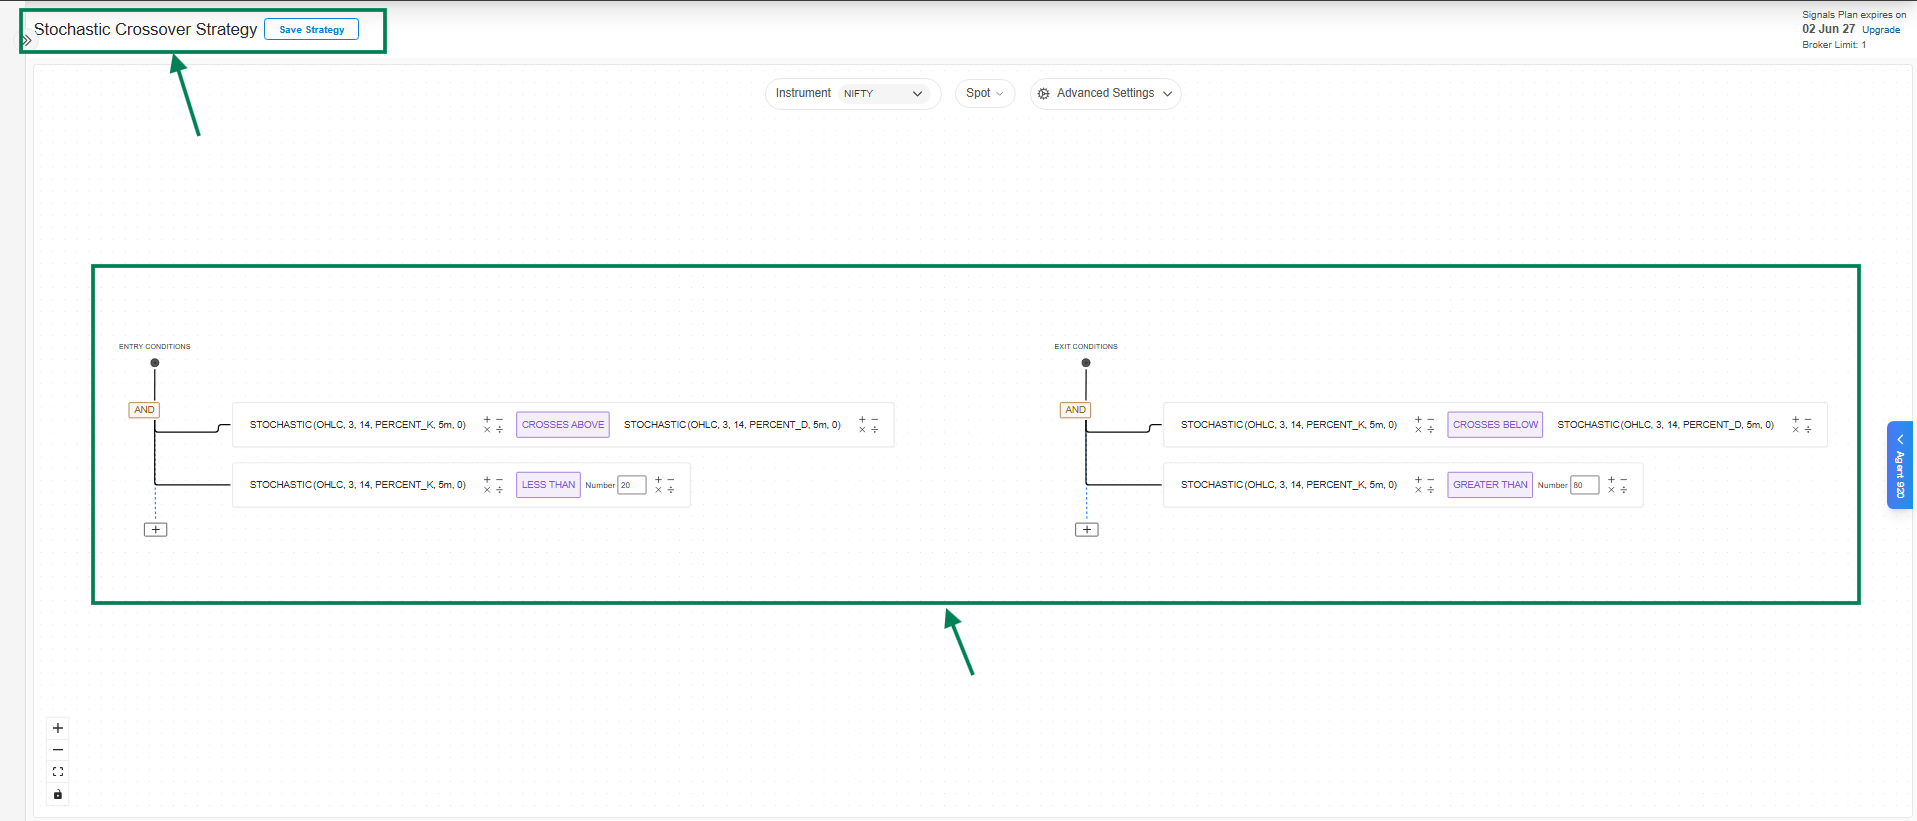
To build this:
- Open Signals AI and tell the AI Agent something like: "Create a Stochastic strategy on NIFTY 5-minute spot where entry is %K crossing above %D and exit is %K crossing below %D." Or build it manually on the Canvas.
- Preview the signal on the chart to confirm entries line up with real %K/%D crossovers.
- Connect a trade and backtest it on historical data.
- Forward test it with paper money, then go live once you're satisfied.
→ Full click-by-click walkthrough: Quickstart: Your First Signal in 10 Minutes
Stochastic PineScript for TradingView
Prefer TradingView? Here's a ready-to-use Stochastic Oscillator strategy template. Paste it into the Pine Editor, adjust the K/D periods, overbought/oversold levels, target, and stop loss to your preference, and backtest it.
To learn how to add this pinescript in TradingView, click here.
This strategy is for demonstration purposes only and is not intended for actual trading. AlgoTest is not responsible for any profit or loss arising from the use of this sample strategy.
//@version=5
strategy("Stochastic Oscillator Strategy", overlay=true)

// Input parameters
k_period = input.int(14, title="K Period")
d_period = input.int(3, title="D Period")
overbought_level = input.int(80, title="Overbought Level")
oversold_level = input.int(20, title="Oversold Level")

target_points = input.int(100, title="Target Points")
stop_loss_points = input.int(50, title="Stop Loss Points")

// Calculate Stochastic Oscillator
k = ta.stoch(close, high, low, k_period)
d = ta.sma(k, d_period)

// Strategy logic
long_condition = ta.crossover(k, d) and k < oversold_level
short_condition = ta.crossunder(k, d) and k > overbought_level

// Plot Stochastic Oscillator
plot(k, color=color.blue, title="K")
plot(d, color=color.red, title="D")

// Strategy entry and exit
if long_condition
    strategy.entry("Long", strategy.long)
if short_condition
    strategy.entry("Short", strategy.short)

// Calculate target and stop loss levels
long_target = strategy.position_avg_price + target_points
long_stop_loss = strategy.position_avg_price - stop_loss_points
short_target = strategy.position_avg_price - target_points
short_stop_loss = strategy.position_avg_price + stop_loss_points

// Strategy exit
strategy.exit("Long Exit", "Long", limit=long_target, stop=long_stop_loss)
strategy.exit("Short Exit", "Short", limit=short_target, stop=short_stop_loss)
Once you've backtested it on TradingView, you can connect the alert to AlgoTest to automate execution, or skip the PineScript and webhook setup entirely by rebuilding the same logic directly in Signals AI above.
FAQ
What is a Stochastic Oscillator used for?
It's used to generate overbought and oversold trading signals, utilizing a 0-100 bounded range of values.
Is RSI or Stochastic better?
Both indicators have their merits; stochastic is faster and might be more suitable for frequent trading, while RSI is more about sustained momentum.
What does Stochastic 14-3-3 mean?
This setting uses a 14-period %K line, a 3-period %D line, and a 3-period slowing.
What are K and D in Stochastic?
%K is the main line indicating the current market rate for the currency pair. %D is the simple moving average of %K.
Is Stochastic Oscillator a good indicator?
Yes, particularly in identifying potential reversal points by comparing the closing price of a security to its price range.
To automate Stochastic strategies without writing code, visit AlgoTest Signals AI.