ADX Indicator
The ADX (Average Directional Index) measures the strength of a trend, not its direction. It's a core part of the Directional Movement System and one of the most reliable ways to tell a trending market from a choppy, ranging one.
What is the ADX Indicator?
Developed by J. Welles Wilder Jr. in 1978, the ADX is composed of three lines:
- ADX: trend strength. Above 25 = strong trend; below 20 = weak/ranging market.
- +DI (Plus Directional Indicator): strength of upward movement
- -DI (Minus Directional Indicator): strength of downward movement
The ADX line itself doesn't show direction; it only quantifies how strong the trend is, whether up or down. Values range from 0 to 100.
How to Read ADX
- ADX above 25: a strong trend is in place; trend-following strategies work well
- ADX below 20: the market is weak or ranging; trend-following strategies tend to whipsaw
- +DI crosses above -DI: potential buy signal (upward directional strength taking over)
- +DI crosses below -DI: potential sell signal (downward directional strength taking over)
Best Use Cases
- Determining Trend Strength: the primary use of ADX: is this market trending, or not worth trend-trading right now?
- Filtering Entries: many traders only take +DI/-DI crossover signals when ADX is above 25, to avoid false signals in choppy markets.
- Combining with Other Indicators: ADX pairs well with RSI or MACD to confirm both trend strength and momentum.
How to Automate an ADX Strategy on Signals AI (No Code)
You don't need TradingView, PineScript, or a webhook to trade ADX signals. Signals AI is AlgoTest's no-code strategy builder. Describe your ADX logic in plain English, or build it visually on the Canvas, and it handles backtesting, paper trading, and live execution with your broker.
ADX parameters on Signals AI:
| Parameter | Default | Description |
|---|---|---|
| period | 14 | Lookback period |
| adx_component | ADX | Which line the condition uses: ADX, PLUS_DI, or MINUS_DI |
Example strategy: ADX filtered DI crossover (NIFTY, 5m)
| Condition | |
|---|---|
| Entry | ADX(14) > 25 AND +DI(14) crosses above -DI(14) |
| Exit | +DI(14) crosses below -DI(14) |
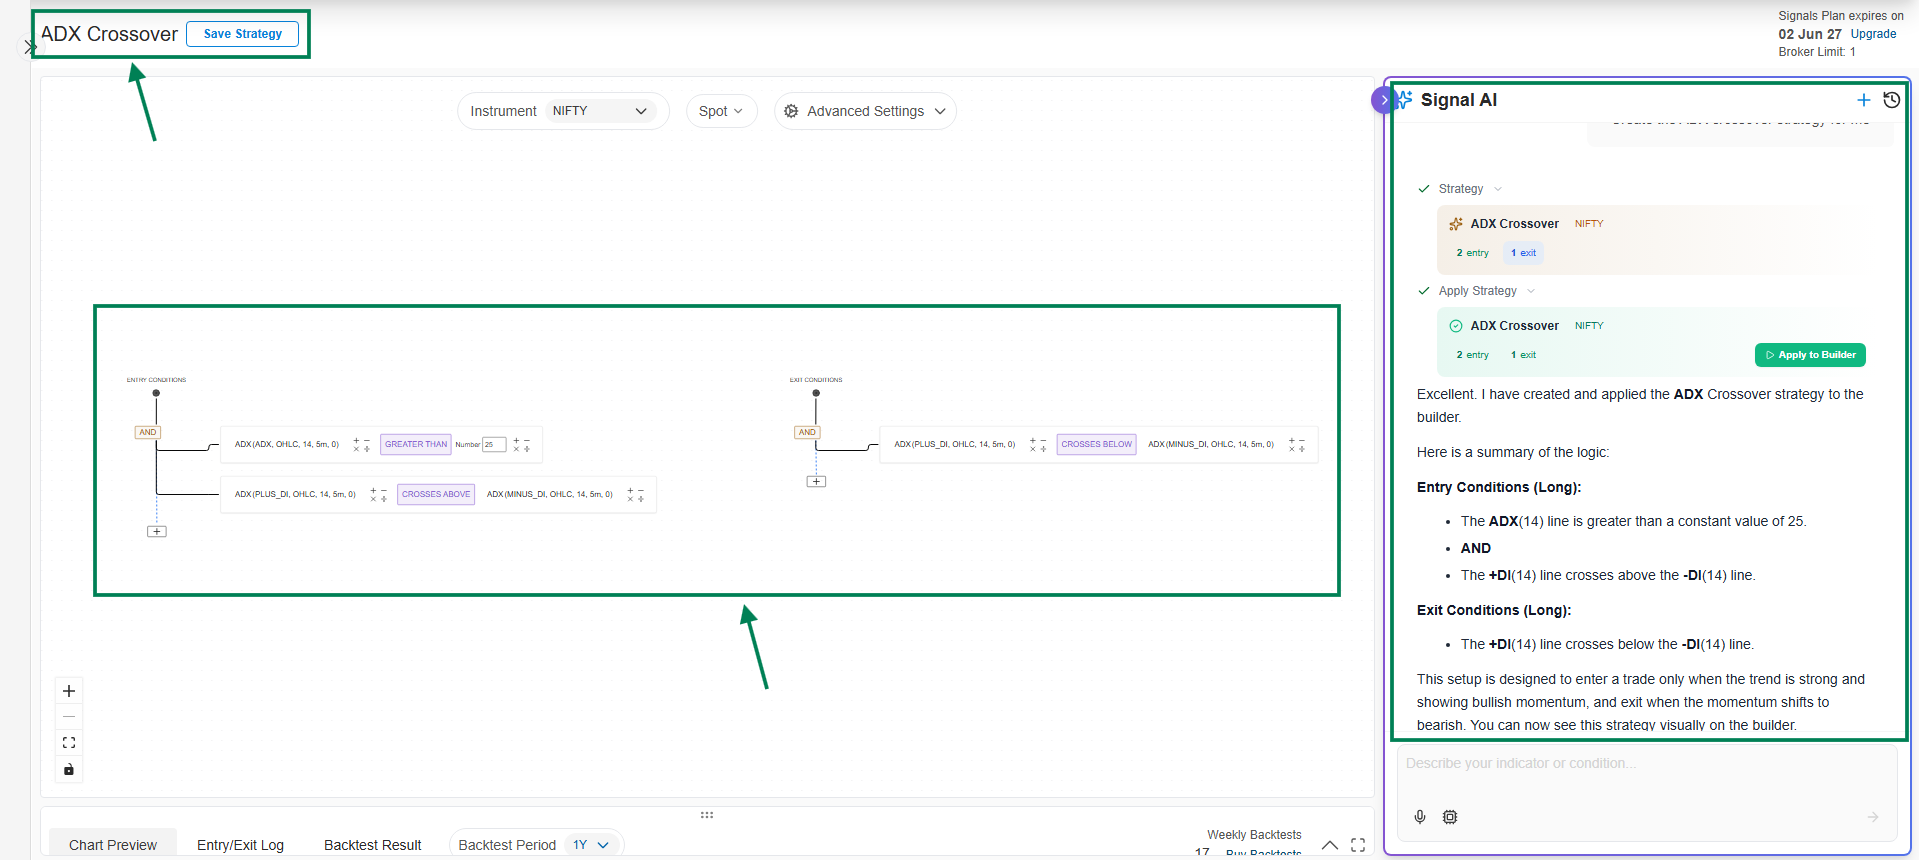
To build this:
- Open Signals AI and tell the AI Agent something like: "Create an ADX strategy on NIFTY 5-minute spot where entry is ADX(14) above 25 and +DI crossing above -DI, and exit is +DI crossing below -DI." Or build it manually on the Canvas using a Logical AND node to combine the ADX threshold with the DI crossover.
- Preview the signal on the chart to confirm entries only fire when ADX is genuinely trending.
- Connect a trade and backtest it on historical data.
- Forward test it with paper money, then go live once you're satisfied.
→ Full click-by-click walkthrough: Quickstart: Your First Signal in 10 Minutes
ADX PineScript for TradingView
Prefer TradingView? Here's a ready-to-use ADX strategy template. Paste it into the Pine Editor, adjust the ADX Length, ADX Threshold, target, and stop loss to your preference, and backtest it.
To learn how to add this pinescript in TradingView, click here.
This strategy is for demonstration purposes only and is not intended for actual trading. AlgoTest is not responsible for any profit or loss arising from the use of this sample strategy.
//@version=5
strategy("ADX Strategy", overlay=true)

// Input parameters
adx_length = input.int(14, title="ADX Length")
adx_threshold = input.int(25, title="ADX Threshold")

target_points = input.int(100, title="Target Points")
stop_loss_points = input.int(50, title="Stop Loss Points")

[PDI, NDI, adx] = ta.dmi(adx_length, adx_threshold)

// Strategy logic
long_condition = adx > adx_threshold and ta.crossover(PDI, NDI)
short_condition = adx > adx_threshold and ta.crossunder(PDI, NDI)

// Plot ADX
plot(adx, color=color.blue, title="ADX")

// Strategy entry and exit
if long_condition
    strategy.entry("Long", strategy.long)
if short_condition
    strategy.entry("Short", strategy.short)

// Calculate target and stop loss levels
long_target = strategy.position_avg_price + target_points
long_stop_loss = strategy.position_avg_price - stop_loss_points
short_target = strategy.position_avg_price - target_points
short_stop_loss = strategy.position_avg_price + stop_loss_points

// Strategy exit
strategy.exit("Long Exit", "Long", limit=long_target, stop=long_stop_loss)
strategy.exit("Short Exit", "Short", limit=short_target, stop=short_stop_loss)
Once you've backtested it on TradingView, you can connect the alert to AlgoTest to automate execution, or skip the PineScript and webhook setup entirely by rebuilding the same logic directly in Signals AI above.
FAQ
What does the ADX indicator tell you?
The ADX helps traders determine the strength of a trend. High ADX values, typically above 25, confirm that the market is trending strongly in one direction.
How do you calculate the ADX?
The ADX is calculated as a moving average of the expanding range between +DI and -DI. It incorporates a smoothing technique, which Wilder explained in his book, to render the ADX an effective gauge of trend strength.
What is the best time frame for the ADX?
The ADX can be applied to any trading time frame, such as daily, hourly, or even minute charts. The best time frame depends on the trading strategy and the trader's analytical preferences.
Which indicator works best with ADX?
Combining ADX with momentum indicators like RSI or MACD can provide a more comprehensive picture of market conditions, helping to confirm the ADX signals.
Is ADX indicator good for day trading?
Yes, the ADX can be used for day trading, but it's important to combine it with other indicators to confirm trading signals due to the ADX's lagging nature.
To automate ADX-based strategies without writing code, visit AlgoTest Signals AI.