Bollinger Bands Indicator
Bollinger Bands are three lines plotted around price that expand and contract with volatility, one of the most widely used tools for reading how "stretched" a market is at any given moment.
What is the Bollinger Bands Indicator?
Developed by John Bollinger in the 1980s, Bollinger Bands consist of:
- Middle Band: a moving average, typically a 20-period SMA
- Upper Band: middle band + N standard deviations (default 2)
- Lower Band: middle band − N standard deviations
The bands widen when volatility rises and narrow when it falls. Price near the upper band suggests overbought conditions; near the lower band, oversold. Price above/below the middle band indicates the prevailing trend direction.
How to Read Bollinger Bands
- Price near/above the upper band: potentially overbought, or a strong breakout if volume confirms
- Price near/below the lower band: potentially oversold, or a breakdown if volume confirms
- Bollinger Band squeeze: bands tighten closely around price during low volatility, often a precursor to a significant move
- Band walk: price repeatedly touches or rides one band in a strong trend, rather than reverting to the middle
Best Use Cases
- Volatility Analysis: the distance between the bands directly measures how volatile an asset currently is.
- Trend Identification: trading outside the typical band range can indicate a strong trend forming.
- Price Targeting: the upper band often acts as dynamic resistance, the lower band as dynamic support.
- Squeeze Strategy: traders watch for a squeeze (tight bands) as an early signal that a breakout is coming.
How to Automate a Bollinger Bands Strategy on Signals AI (No Code)
You don't need TradingView, PineScript, or a webhook to trade Bollinger Bands signals. Signals AI is AlgoTest's no-code strategy builder. Describe your Bollinger Bands strategy in plain English, or build it visually on the Canvas, and it handles backtesting, paper trading, and live execution with your broker.
Bollinger Bands parameters on Signals AI:
| Parameter | Default | Description |
|---|---|---|
| period | 20 | Lookback for the middle band |
| standard_deviations | 2 | Band width: higher = wider bands, fewer signals; lower = tighter bands, more signals |
| band_type | N/A | Which band the condition uses: Upper, Middle, or Lower |
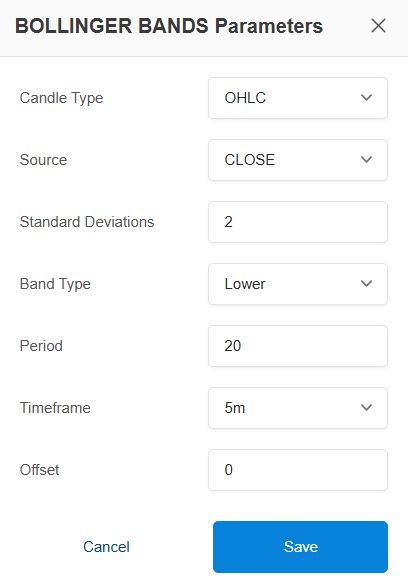
Example strategy: breakout (trending markets)
| Condition | |
|---|---|
| Entry | Close crosses above the Upper Band (breakout with strong upward momentum) |
| Exit | Close crosses below the Lower Band |
This breakout strategy suits trending markets. In ranging markets, traders often invert the logic: buy at the lower band, exit at the upper band (mean reversion). Know which market you're in, or filter with ADX.
To build this:
- Open Signals AI and tell the AI Agent something like: "Create a Bollinger Bands breakout strategy on NIFTY 5-minute spot where entry is Close crossing above the Upper Band and exit is Close crossing below the Lower Band." Or build it manually on the Canvas.
- Preview the signal on the chart to confirm entries line up with real band breakouts or bounces.
- Connect a trade and backtest it on historical data.
- Forward test it with paper money, then go live once you're satisfied.
→ Full click-by-click walkthrough: Quickstart: Your First Signal in 10 Minutes
Bollinger Bands PineScript for TradingView
Prefer TradingView? Here's a ready-to-use Bollinger Bands strategy template. Paste it into the Pine Editor, adjust the length, multiplier, target, and stop loss to your preference, and backtest it.
To learn how to add this pinescript in TradingView, click here.
This strategy is for demonstration purposes only and is not intended for actual trading. AlgoTest is not responsible for any profit or loss arising from the use of this sample strategy.
//@version=5
strategy("Bollinger Bands Strategy", overlay=true)

// Input parameters
length = input.int(20, title="BB Length")
mult = input.float(2.0, title="BB Multiplier")
target_points = input.int(100, title="Target Points")
stop_loss_points = input.int(50, title="Stop Loss Points")

// Calculate Bollinger Bands
basis = ta.sma(close, length)
dev = mult * ta.stdev(close, length)
upper_band = basis + dev
lower_band = basis - dev

// Strategy logic
long_condition = ta.crossover(close, lower_band)
short_condition = ta.crossunder(close, upper_band)

// Plot Bollinger Bands
plot(upper_band, color=color.blue, title="Upper Band")
plot(lower_band, color=color.red, title="Lower Band")

// Strategy entry
if long_condition
    strategy.entry("Long", strategy.long)
if short_condition
    strategy.entry("Short", strategy.short)

// Calculate target and stop loss levels
long_target = strategy.position_avg_price + target_points
long_stop_loss = strategy.position_avg_price - stop_loss_points
short_target = strategy.position_avg_price - target_points
short_stop_loss = strategy.position_avg_price + stop_loss_points

// Strategy exit
strategy.exit("Long Exit", "Long", limit=long_target, stop=long_stop_loss)
strategy.exit("Short Exit", "Short", limit=short_target, stop=short_stop_loss)
Once you've backtested it on TradingView, you can connect the alert to AlgoTest to automate execution, or skip the PineScript and webhook setup entirely by rebuilding the same logic directly in Signals AI above.
FAQ
How do you use the Bollinger Band indicator?
Bollinger Bands are typically used to measure market volatility and identify overbought or oversold conditions. Traders may look for stock prices crossing above or below the bands as buy or sell signals, respectively.
What is the best setting for Bollinger Bands?
The standard setting for Bollinger Bands is a 20-day simple moving average with bands drawn at 2 standard deviations. However, settings can be adjusted for shorter or longer timeframes based on trading strategy needs.
What does a Bollinger Bands squeeze indicate?
A Bollinger Bands squeeze suggests that the market is very low in volatility and is often followed by a significant move in either direction, indicating a potential breakout.
Is the Bollinger Band strategy profitable?
Like any trading indicator, the profitability of Bollinger Bands depends on the trader's skill in using them in conjunction with other technical analysis tools and market conditions. They are not foolproof but can be a powerful component of a diversified trading strategy.
Which indicators pair well with Bollinger Bands?
Traders often combine Bollinger Bands with momentum indicators like the Relative Strength Index (RSI) or the Moving Average Convergence Divergence (MACD) to confirm signals and enhance trading decisions.
To automate Bollinger Bands strategies without writing code, visit AlgoTest Signals AI.