Moving Average (MA) Crossover Indicator
A Moving Average crossover is one of the oldest and most widely used technical analysis signals: plot two moving averages of different lengths on a chart, and trade the moment the shorter one crosses the longer one.
What is a Moving Average Crossover?
Two moving averages are plotted, one shorter-term and one longer-term, and traders watch for the moment they cross:
- Bullish crossover: the shorter MA crosses above the longer MA, suggesting a potential upward trend
- Bearish crossover: the shorter MA crosses below the longer MA, suggesting a potential downward trend
The moving averages themselves can be SMA (Simple), EMA (Exponential, more responsive to recent price), or WMA (Weighted). The most popular variant by far is the EMA crossover strategy, since EMA reacts faster to new price action than a plain SMA.
How to Read an MA Crossover
- Fast MA crosses above Slow MA: potential entry for a long position
- Fast MA crosses below Slow MA: potential entry for a short position, or exit for an existing long
- Common pairs: 9/21 EMA (short-term, intraday), 20/50 EMA (swing), 50/200 (the "Golden Cross" / "Death Cross" on daily charts, used for long-term trend calls)
Best Use Cases
- Trend Identification: a bullish crossover flags the possible start of an uptrend; a bearish one, a downtrend.
- Trade Entries and Exits: enter when the fast MA crosses above the slow MA, exit on the reverse cross.
- Filtering Noise: moving averages smooth out short-term price noise, making the underlying trend easier to read.
How to Automate an EMA Crossover Strategy on Signals AI (No Code)
You don't need TradingView, PineScript, or a webhook to trade an MA crossover strategy. Signals AI is AlgoTest's no-code strategy builder. Describe your strategy in plain English, or build it visually on the Canvas, and it handles backtesting, paper trading, and live execution with your broker. EMA, SMA, WMA, and VWMA are all available as indicators.
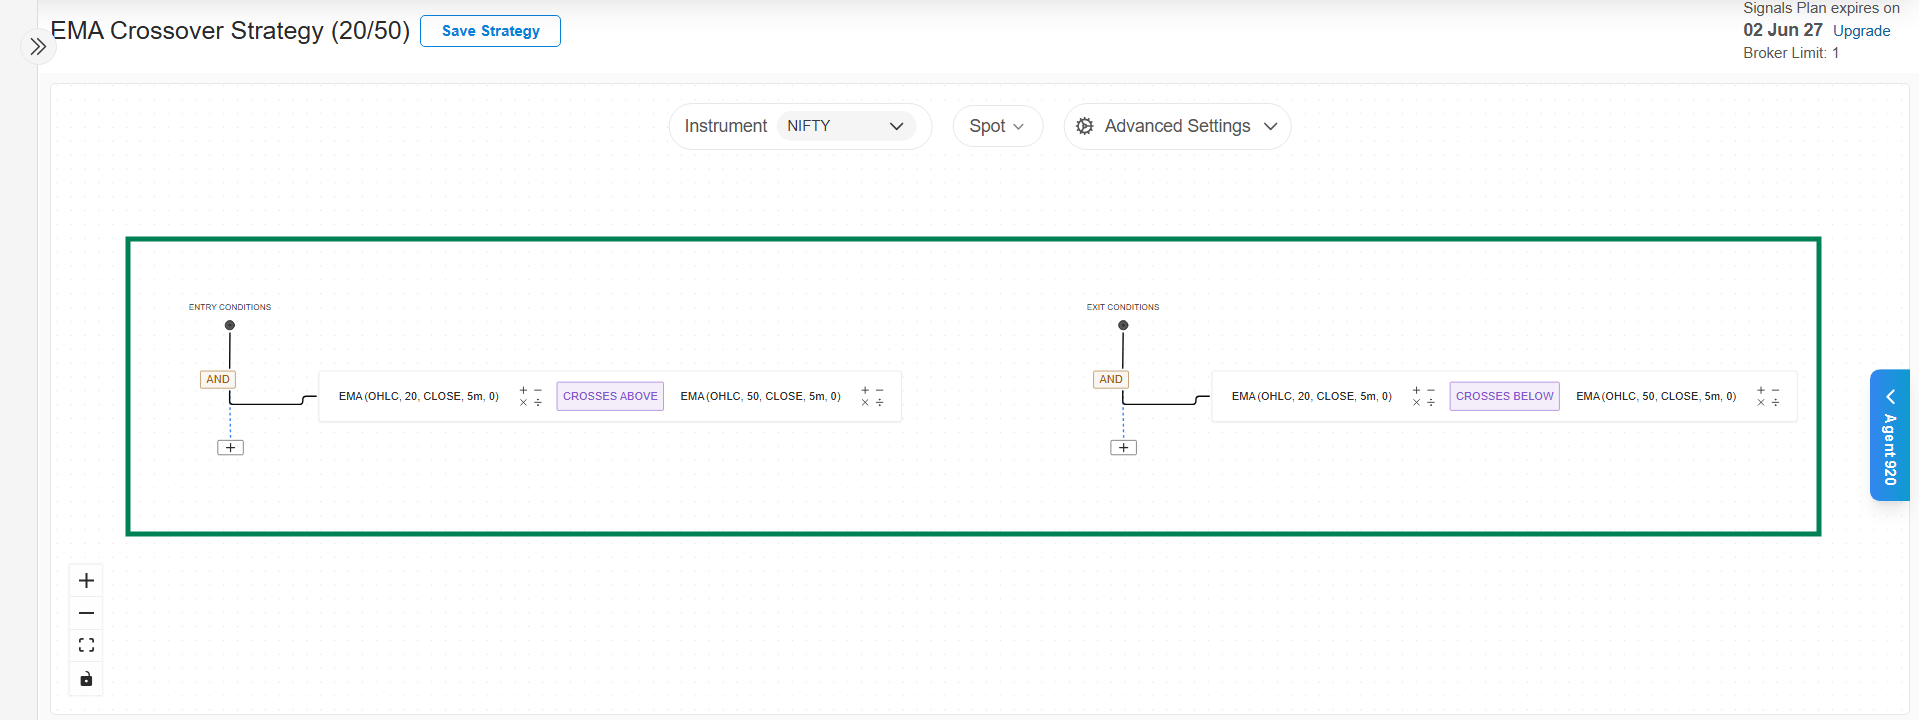
Example strategy: EMA 20/50 crossover
| Condition | |
|---|---|
| Entry | EMA(20) crosses above EMA(50), 5m timeframe |
| Exit | EMA(20) crosses below EMA(50) |
To build this:
-
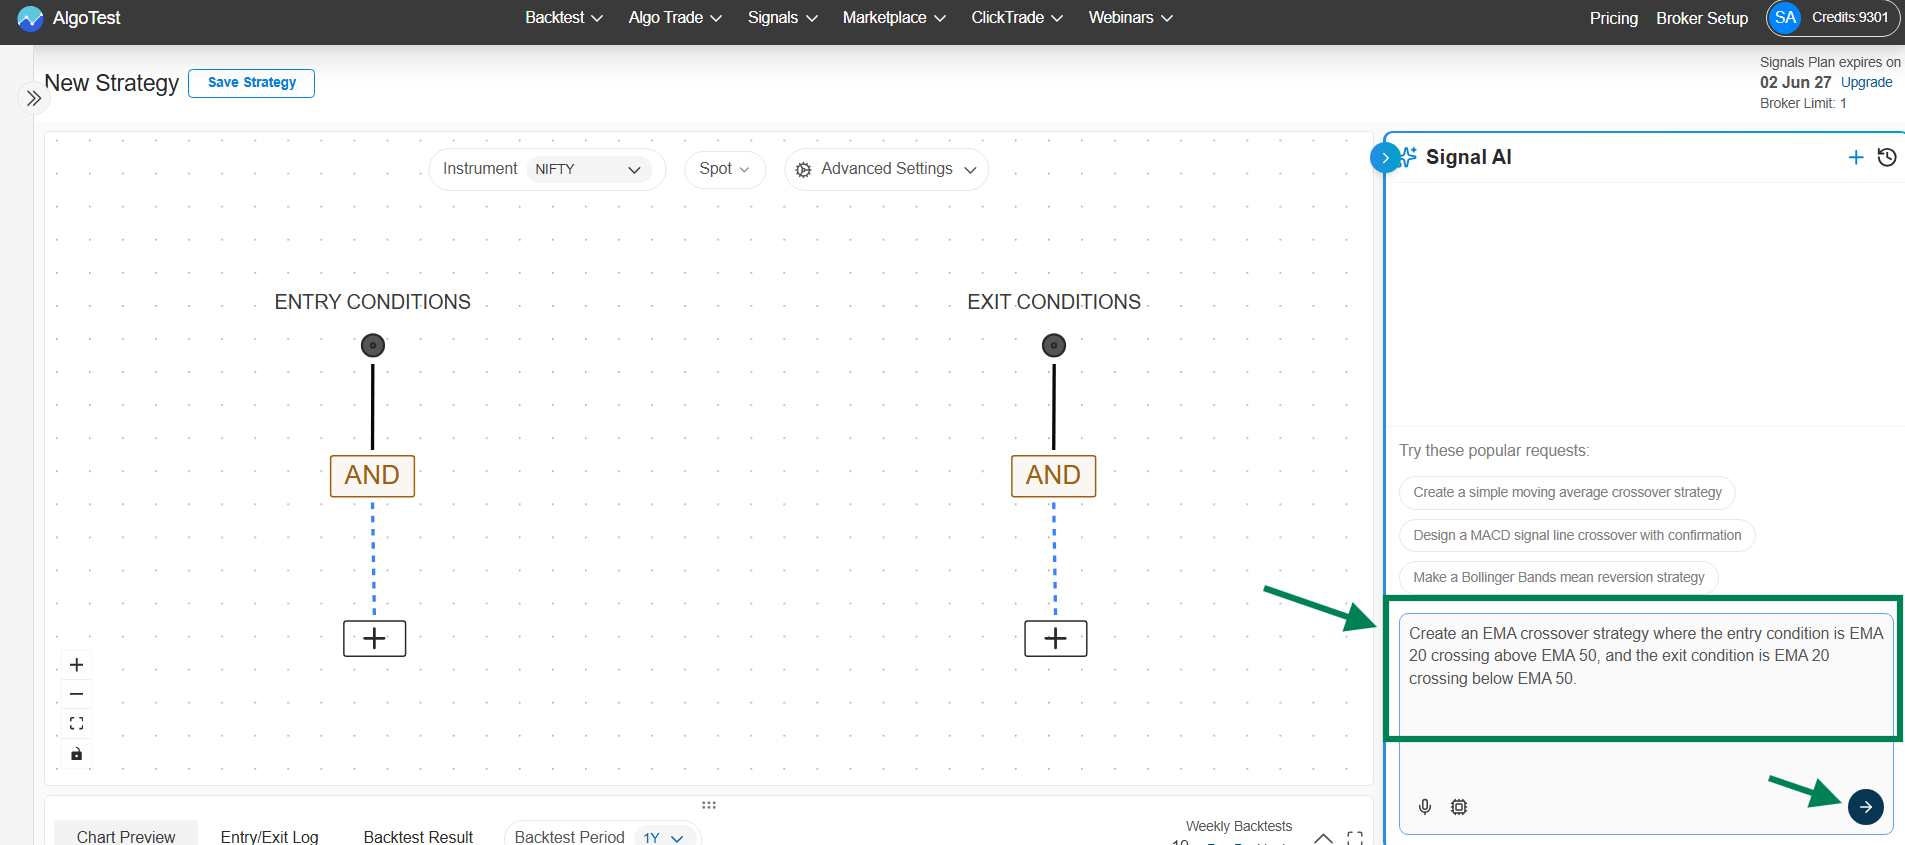
Open Signals AI and tell the AI Agent:
Create an EMA crossover strategy where the entry condition is EMA 20 crossing above EMA 50, and the exit condition is EMA 20 crossing below EMA 50. Use the 5-minute timeframe on NIFTY spot.
-
Or build it manually on the Canvas: add a Comparison Node, search for EMA, set Period 20 for the fast leg and Period 50 for the slow leg, and use the Crosses Above / Crosses Below operator.
-
Preview the signal on the chart to confirm entries line up with real crossovers.
-
Connect a trade and backtest it on historical data.
-
Forward test it with paper money, then go live once you're satisfied.
Want SMA or WMA instead of EMA? Same steps, just swap the indicator on the node.
→ Full click-by-click walkthrough: Quickstart: Your First Signal in 10 Minutes
MA Crossover PineScript for TradingView
Prefer TradingView? Here's a ready-to-use Moving Average crossover strategy template (SMA-based by default; swap ta.sma for ta.ema if you want the EMA version). Paste it into the Pine Editor, adjust the lengths, target, and stop loss to your preference, and backtest it.
To learn how to add this pinescript in TradingView, click here.
This strategy is for demonstration purposes only and is not intended for actual trading. AlgoTest is not responsible for any profit or loss arising from the use of this sample strategy.
//@version=5
strategy("Moving Averages Strategy", overlay=true)

// Input parameters
fast_length = input.int(9, title="Fast MA Length")
slow_length = input.int(21, title="Slow MA Length")
target_points = input.int(100, title="Target Points")
stop_loss_points = input.int(50, title="Stop Loss Points")

// Calculate moving averages
fast_ma = ta.sma(close, fast_length)
slow_ma = ta.sma(close, slow_length)

// Strategy logic
long_condition = ta.crossover(fast_ma, slow_ma)
short_condition = ta.crossunder(fast_ma, slow_ma)

// Plot moving averages
plot(fast_ma, color=color.blue, title="Fast MA")
plot(slow_ma, color=color.red, title="Slow MA")

// Strategy entry
if long_condition
    strategy.entry("Long", strategy.long)
if short_condition
    strategy.entry("Short", strategy.short)

// Calculate target and stop loss levels
long_target = strategy.position_avg_price + target_points
long_stop_loss = strategy.position_avg_price - stop_loss_points
short_target = strategy.position_avg_price - target_points
short_stop_loss = strategy.position_avg_price + stop_loss_points

// Strategy exit
strategy.exit("Long Exit", "Long", limit=long_target, stop=long_stop_loss)
strategy.exit("Short Exit", "Short", limit=short_target, stop=short_stop_loss)
Once you've backtested it on TradingView, you can connect the alert to AlgoTest to automate execution, or skip the PineScript and webhook setup entirely by rebuilding the same logic directly in Signals AI above.
FAQ
Which is the best EMA crossover strategy?
The best EMA crossover strategy typically involves using commonly followed periods like the 50-day and 200-day EMAs. This is known as the "Golden Cross" when the 50 crosses above the 200, and the "Death Cross" when it crosses below. For intraday, 9/21 and 20/50 EMA pairs on lower timeframes are more common.
What is the 3 MA cross strategy?
The 3 MA cross strategy involves using three different moving averages, typically a combination of short, medium, and long-term MAs. A signal is generated when all three align in a specific order indicating a strong trend.
Does MA crossover work?
MA crossovers can be effective in trend-following contexts but may generate false signals in ranging or choppy markets. Their effectiveness improves when combined with other forms of technical analysis, like ADX for trend strength.
What happens when 200 MA crosses 50 MA?
When the 200-day MA crosses above the 50-day MA, it's considered a bearish signal (Death Cross), indicating potential selling pressure ahead. Conversely, if the 200-day MA crosses below the 50-day MA, it is seen as a bullish signal (Golden Cross).
What does MA cross mean?
An MA cross occurs when one moving average crosses over another. It is interpreted as a sign that momentum is shifting, and potentially a new trend is beginning.
What is the 9/21 EMA crossover strategy?
This strategy uses two EMAs: a fast (9-period) and a slow (21-period). A buy signal is generated when the 9-period EMA crosses above the 21-period EMA, and a sell signal when it crosses below. It's a popular choice for short-term, intraday setups.
For more insights and detailed trading signals based on MA crossovers and other strategies, visit AlgoTest Signals AI.