RSI Indicator
The RSI (Relative Strength Index) is a momentum oscillator between 0 and 100 that measures the speed and change of price movements. It's one of the most widely used indicators for spotting overbought/oversold conditions and momentum reversals.
What is the RSI Indicator?
Developed by J. Welles Wilder Jr. in 1978 and introduced in his book New Concepts in Technical Trading Systems, the RSI compares the magnitude of recent gains to recent losses over a lookback period (14 by default) to gauge whether a security is overbought or oversold.
RSI formula: RSI = 100 − (100 / (1 + RS)), where RS is the average gain of up periods divided by the average loss of down periods over the specified period.
How to Read RSI
- Above 70: overbought; potential pullback
- Below 30: oversold; potential bounce
- Crossing above 30: bearish momentum fading, often read as bullish
- Crossing below 70: market likely due a pullback, often read as bearish
RSI Divergence
Divergence is one of RSI's strongest signals. It happens when price and RSI disagree:
- Bearish divergence: price makes a new high, but RSI makes a lower high. Momentum is weakening even though price is still rising, often a warning of a reversal.
- Bullish divergence: price makes a new low, but RSI makes a higher low. Selling pressure is fading even though price is still falling.
Divergence doesn't time an entry by itself; traders typically wait for a confirming candle, trendline break, or a second indicator before acting on it.
Best Use Cases
- Trending markets: helps identify likely continuation of the current trend
- Range-bound markets: signals potential entries/exits at overbought and oversold extremes
- Commodities and forex: the volatility in these markets often produces cleaner RSI signals
How to Automate an RSI Strategy on Signals AI (No Code)
You don't need TradingView, PineScript, or a webhook to trade RSI signals. Signals AI is AlgoTest's no-code strategy builder. Describe your RSI logic in plain English, or build it visually on the Canvas, and it handles backtesting, paper trading, and live execution with your broker.
RSI parameters on Signals AI:
| Parameter | Default | Description |
|---|---|---|
| period | 14 | Shorter = more sensitive; longer = smoother |
| source | CLOSE | Standard price source |
| candle_type | OHLC | OHLC or HEIKIN_ASHI |

Example strategy: RSI crossover (NIFTY, 5m)
| Condition | |
|---|---|
| Entry | RSI(14) crosses above 30 (bearish momentum fading) |
| Exit | RSI(14) crosses above 70 (market likely due a pullback) |
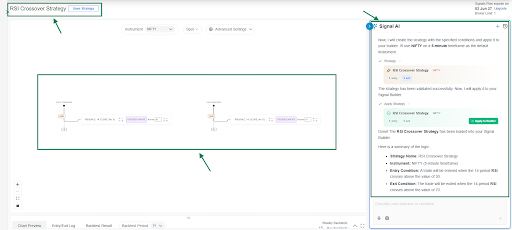
To build this:
- Open Signals AI and tell the AI Agent something like: "Create an RSI strategy on NIFTY 5-minute spot where entry is RSI(14) crossing above 30 and exit is RSI(14) crossing above 70." Or add an RSI Comparison Node manually on the Canvas.
- Preview the signal on the chart to confirm entries/exits line up with real RSI crossovers.
- Connect a trade and backtest it on historical data.
- Forward test it with paper money, then go live once you're satisfied.
→ Full click-by-click walkthrough: Quickstart: Your First Signal in 10 Minutes
RSI PineScript for TradingView
Prefer TradingView? Here's a ready-to-use RSI strategy template. Paste it into the Pine Editor, adjust the RSI Length, Overbought/Oversold levels, target, and stop loss to your preference, and backtest it.
To learn how to add this pinescript in TradingView, click here.
This strategy is for demonstration purposes only and is not intended for actual trading. AlgoTest is not responsible for any profit or loss arising from the use of this sample strategy.
//@version=5
strategy("RSI Strategy", overlay=true)

// Input parameters
rsi_length = input.int(14, title="RSI Length")
overbought_level = input.int(70, title="Overbought Level")
oversold_level = input.int(30, title="Oversold Level")
target_points = input.int(100, title="Target Points")
stop_loss_points = input.int(50, title="Stop Loss Points")

// Calculate RSI
rsi = ta.rsi(close, rsi_length)

// Strategy logic
long_condition = ta.crossover(rsi, oversold_level)
short_condition = ta.crossunder(rsi, overbought_level)

// Plot RSI
plot(rsi, color=color.blue, title="RSI")

// Strategy entry
if long_condition
    strategy.entry("Long", strategy.long)
if short_condition
    strategy.entry("Short", strategy.short)

// Calculate target and stop loss levels
long_target = strategy.position_avg_price + target_points
long_stop_loss = strategy.position_avg_price - stop_loss_points
short_target = strategy.position_avg_price - target_points
short_stop_loss = strategy.position_avg_price + stop_loss_points

// Strategy exit
strategy.exit("Long Exit", "Long", limit=long_target, stop=long_stop_loss)
strategy.exit("Short Exit", "Short", limit=short_target, stop=short_stop_loss)
Once you've backtested it on TradingView, you can connect the alert to AlgoTest to automate execution, or skip the PineScript and webhook setup entirely by rebuilding the same logic directly in Signals AI above.
FAQ
What is a good RSI indicator?
A good RSI indicator typically has a value set at 14 periods and is used to identify overbought or oversold conditions in the market. Values above 70 indicate overbought conditions, suggesting a potential sell, while values below 30 indicate oversold conditions, suggesting a potential buy.
What does RSI 14 mean, and what do various numbers like RSI 6, 12, 24, 30/70, 60/40, 70/30 signify?
RSI 14 means the Relative Strength Index is calculated using the past 14 periods. Other numbers such as RSI 6, 12, or 24 indicate the indicator is calculated over those specific periods, offering more sensitivity or smoothness. Thresholds like 30/70, 60/40, and 70/30 are levels that indicate potential buy or sell signals; for example, below 30 is considered oversold, and above 70 is considered overbought.
What is RSI indicator and how does it work?
The Relative Strength Index (RSI) is a momentum oscillator that measures the speed and change of price movements. It works by comparing the magnitude of recent gains to recent losses to evaluate overbought or oversold conditions in the price of a stock or other asset.
How is the RSI indicator calculated?
The RSI indicator is calculated using this formula: RSI = 100 - (100 / (1 + RS)), where RS is the average gain of up periods divided by the average loss of down periods over the specified period.
What are the best settings for the RSI indicator?
The best settings for the RSI indicator typically depend on the trader's specific strategy and the market conditions, but the standard setting is 14 periods. This can be adjusted based on the volatility of the trading instrument to make the indicator more or less sensitive.
How do you set up an RSI indicator?
To set up an RSI indicator, you can add it to your trading chart software, select the period setting (commonly 14), and define the overbought and oversold levels (typically 70 and 30, respectively). On Signals AI, you add it as a node on the Canvas with the same parameters, no separate chart software required.
How to use the RSI indicator effectively?
To use the RSI indicator effectively, monitor for levels that indicate overbought or oversold conditions. Consider using RSI in conjunction with other technical indicators or chart patterns to confirm trading signals.
What are the buy and sell signals for RSI?
Buy signals are typically given when the RSI crosses above an oversold threshold (e.g., 30), indicating potential upward momentum. Sell signals are given when the RSI crosses below an overbought threshold (e.g., 70), indicating potential downward momentum.
What is the best strategy for RSI trading?
The best strategy often involves looking for divergences where the price makes a new high or low that is not supported by the RSI, suggesting a potential reversal. Combining RSI readings with support/resistance levels, trend lines, and candlestick patterns can also enhance its effectiveness.
How do you use RSI to buy and sell?
Use RSI to buy when the indicator moves out of the oversold region (below 30) signaling a potential upward move. Sell when RSI moves out of the overbought region (above 70), signaling a potential downward move.
Which is better: RSI or stochastic RSI?
The choice between RSI and stochastic RSI depends on the trader's preference and the specific market conditions. Stochastic RSI is generally faster and more sensitive than traditional RSI.
Is RSI or MACD better for divergence?
Both indicators are useful for spotting divergence, but MACD might be preferred for its ability to also track the momentum and trend direction, providing a more holistic view.
Which indicator works best with RSI?
RSI works well with MACD, stochastic oscillators, and moving averages to confirm trend directions and potential reversal points.
Is RSI a good indicator for gold trading?
Yes, RSI can be effective for trading gold as it helps to identify potential reversal points in volatile markets like commodities.
How do you read a stochastic RSI?
Stochastic RSI oscillates between 0 and 1; readings above 0.8 suggest overbought conditions, while readings below 0.2 suggest oversold conditions.
What is the 70 30 RSI strategy?
This strategy involves buying when the RSI crosses above 30 from below (indicating emerging bullish momentum) and selling when the RSI crosses below 70 from above (indicating potential bearish momentum).
What is the formula code for RSI?
The formula for RSI is RSI = 100 - (100 / (1 + (Average Gain / Average Loss))).
What are the 2 lines in stochastic RSI?
In stochastic RSI, the two lines are the %K (the stochastic RSI itself) and %D (a moving average of %K), which help indicate momentum and potential reversal points.
Which timeframe is best for stochastic RSI?
The best timeframe for stochastic RSI depends on the trader's style; shorter timeframes are generally better for day trading, while longer ones may be suited for swing trading.
How accurate is the RSI indicator?
While RSI is a popular and widely used indicator, its accuracy can depend on market conditions and how it's used in conjunction with other indicators and analysis methods.
Is RSI indicator free and where can I see my RSI indicator?
Yes, the RSI indicator is typically available for free in most trading platforms and can be found in the indicator or analysis section within these platforms. On AlgoTest, RSI is available for free inside Signals AI, no separate charting subscription needed.
For more insights and detailed analysis tools, visit AlgoTest Signals AI.