MACD Indicator
The MACD (Moving Average Convergence Divergence) is a trend-following momentum indicator that shows the relationship between two moving averages of a security's price. It's one of the most widely used indicators in technical analysis.
What is the MACD Indicator?
Created by Gerald Appel in the late 1970s, MACD is designed to reveal changes in the strength, direction, momentum, and duration of a trend. It's made up of three components:
- MACD Line: the 12-period EMA minus the 26-period EMA: short-term momentum
- Signal Line: a 9-period EMA of the MACD Line: the trigger line
- Histogram: MACD Line minus Signal Line: positive means bullish momentum, negative means bearish
How to Read MACD
- MACD line crosses above the signal line: bullish signal, price likely to see upward momentum
- MACD line crosses below the signal line: bearish signal, price likely to see downward momentum
- MACD crossing above/below the zero line: signals a potential broader trend change
- Divergence between MACD and price: a strong signal that the current trend may be ending
Best Use Cases
- Trend Confirmation: a positive MACD indicates the short-term average is above the long-term average, signaling upward momentum.
- Buy/Sell Signals: signal line crossovers, zero-line crossovers, and divergence are the three classic MACD signals.
- Divergence: when price and MACD disagree, it often signals the end of the current trend.
How to Automate a MACD Strategy on Signals AI (No Code)
You don't need TradingView, PineScript, or a webhook to trade MACD signals. Signals AI is AlgoTest's no-code strategy builder. Describe your MACD logic in plain English, or build it visually on the Canvas, and it handles backtesting, paper trading, and live execution with your broker.
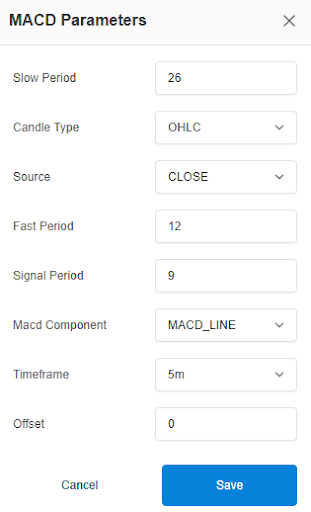
MACD parameters on Signals AI:
| Parameter | Default | Description |
|---|---|---|
| fast_period | 12 | Fast EMA period |
| slow_period | 26 | Slow EMA period |
| signal_period | 9 | Signal line EMA period |
| source | CLOSE | Price source |
| macd_component | MACD_LINE | Which output the condition uses: MACD_LINE, SIGNAL_LINE, or HISTOGRAM |
Example strategy: MACD crossover
| Condition | |
|---|---|
| Entry | MACD Line crosses above Signal Line |
| Exit | MACD Line crosses below Signal Line |
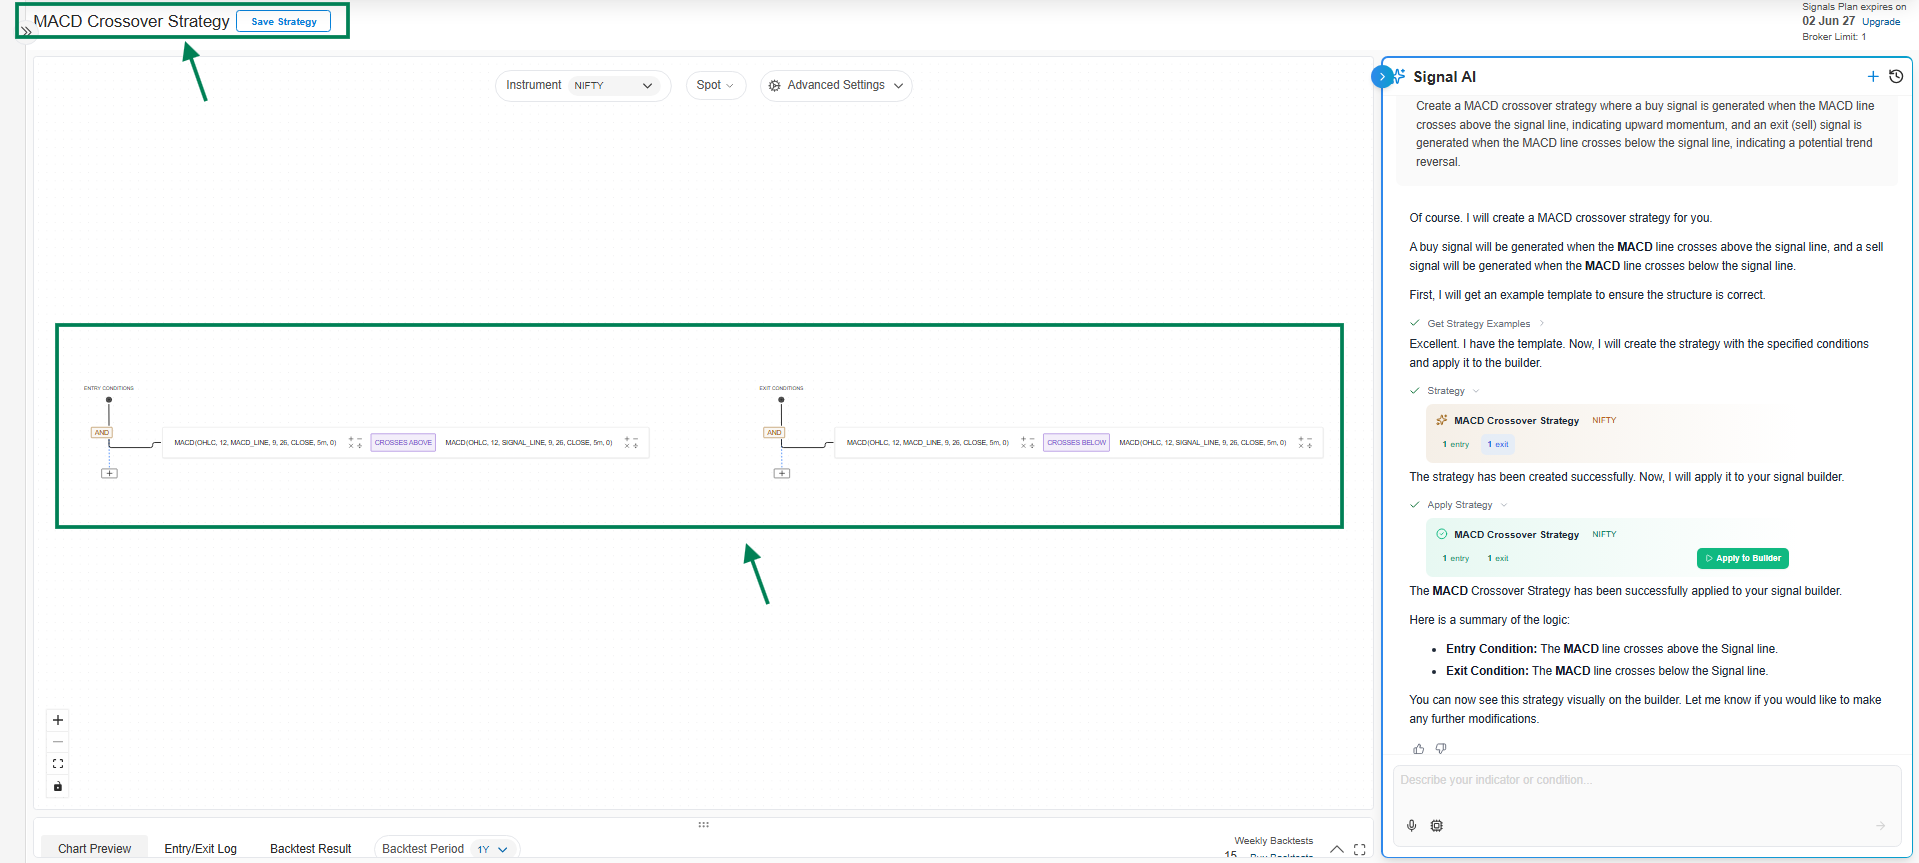
To build this:
- Open Signals AI and tell the AI Agent something like: "Create a MACD strategy on NIFTY 5-minute spot where entry is MACD line crossing above signal line and exit is MACD line crossing below signal line." Or add a MACD Comparison Node manually on the Canvas.
- Preview the signal on the chart to confirm entries/exits line up with real MACD crossovers.
- Connect a trade and backtest it on historical data.
- Forward test it with paper money, then go live once you're satisfied.
→ Full click-by-click walkthrough: Quickstart: Your First Signal in 10 Minutes
MACD PineScript for TradingView
Prefer TradingView? Here's a ready-to-use MACD strategy template. Paste it into the Pine Editor, adjust the EMA lengths, target, and stop loss to your preference, and backtest it.
To learn how to add this pinescript in TradingView, click here.
This strategy is for demonstration purposes only and is not intended for actual trading. AlgoTest is not responsible for any profit or loss arising from the use of this sample strategy.
//@version=5
strategy("MACD Strategy", overlay=true)

// Input parameters
fast_length = input.int(12, title="Fast EMA Length")
slow_length = input.int(26, title="Slow EMA Length")
signal_length = input.int(9, title="Signal Line Length")

target_points = input.int(100, title="Target Points")
stop_loss_points = input.int(50, title="Stop Loss Points")

// Calculate MACD
[macd_line, signal_line, _] = ta.macd(close, fast_length, slow_length, signal_length)

// Strategy logic
long_condition = ta.crossover(macd_line, signal_line)
short_condition = ta.crossunder(macd_line, signal_line)

// Plot MACD
plot(macd_line, color=color.blue, title="MACD Line")
plot(signal_line, color=color.red, title="Signal Line")

// Strategy entry and exit
if long_condition
    strategy.entry("Long", strategy.long)
if short_condition
    strategy.entry("Short", strategy.short)

// Calculate target and stop loss levels
long_target = strategy.position_avg_price + target_points
long_stop_loss = strategy.position_avg_price - stop_loss_points
short_target = strategy.position_avg_price - target_points
short_stop_loss = strategy.position_avg_price + stop_loss_points

// Strategy exit
strategy.exit("Long Exit", "Long", limit=long_target, stop=long_stop_loss)
strategy.exit("Short Exit", "Short", limit=short_target, stop=short_stop_loss)
Once you've backtested it on TradingView, you can connect the alert to AlgoTest to automate execution, or skip the PineScript and webhook setup entirely by rebuilding the same logic directly in Signals AI above.
FAQ
What is the best strategy for MACD?
The most effective strategy using MACD is to trade on signal line crossovers. Combining this with confirmation from other indicators can increase the reliability of the signals.
How do you use MACD for beginners?
Beginners should start by observing how the MACD line and the signal line crossover correlates with price movement, and then practice with historical data before executing live trades.
What is a good MACD signal?
A good MACD signal for buying is when the MACD line crosses above the signal line, ideally above the zero line. For selling, a good signal is when the MACD line crosses below the signal line, ideally below the zero line.
Which time frame is best for MACD?
The best time frame for using MACD can vary depending on your trading strategy, but generally, medium to long-term time frames such as 1-hour, 4-hour, or daily charts are commonly used.
What does 12 26 9 mean on MACD?
These numbers represent the settings for the MACD indicator: the 12 represents the previous 12 bars of the faster moving average, 26 represents the previous 26 bars of the slower moving average, and 9 is the number of bars to calculate the difference between the fast and slow moving averages (the signal line).
For more insights and detailed analysis tools, visit AlgoTest Signals AI.