Choosing an Instrument & Chart Data
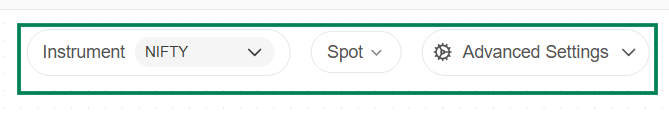
Two choices define what your indicators are calculated on:
- Instrument - what you're trading (NIFTY, RELIANCE, BTCUSD…)
- Chart data - which price series the indicators run on (Spot, Futures, Options, Synthetic Futures, or Combined Premium)
The same EMA crossover behaves very differently on a spot chart vs an option premium chart, so this choice matters as much as your conditions.
Step 1: Select the instrument
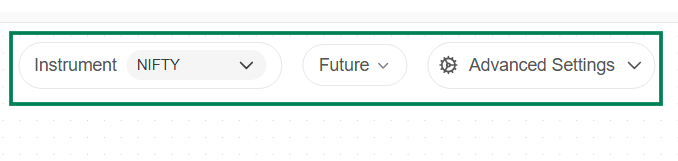
Click the Instrument dropdown on the Canvas and search or select.
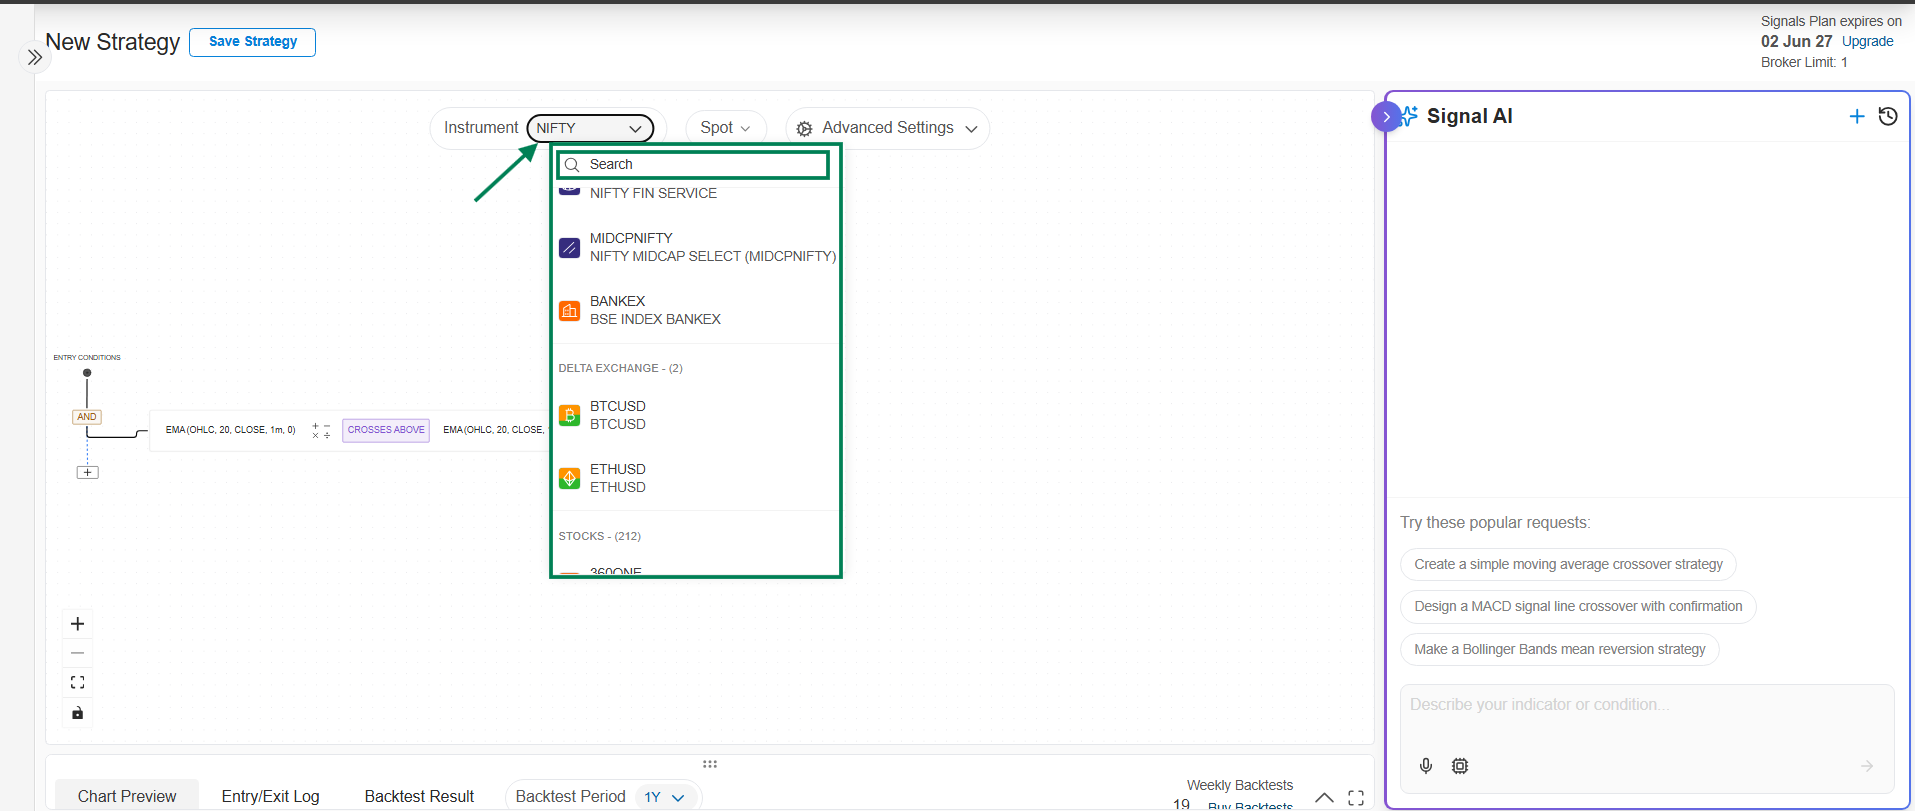
Supported instruments:
| Category | Instruments |
|---|---|
| Indices | NIFTY, BANKNIFTY, SENSEX, MIDCPNIFTY, FINNIFTY, BANKEX |
| Stocks | All NSE F&O enabled stocks |
| Crypto | BTCUSD, ETHUSD (traded via Delta Exchange) |
MCX commodities, and non-F&O stocks are not supported.
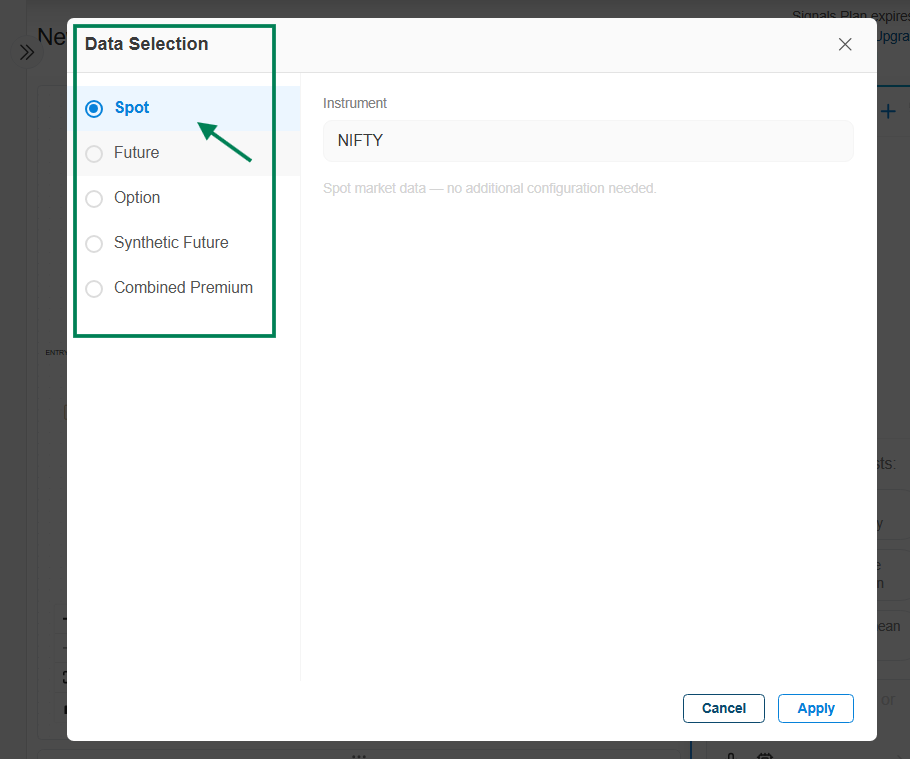
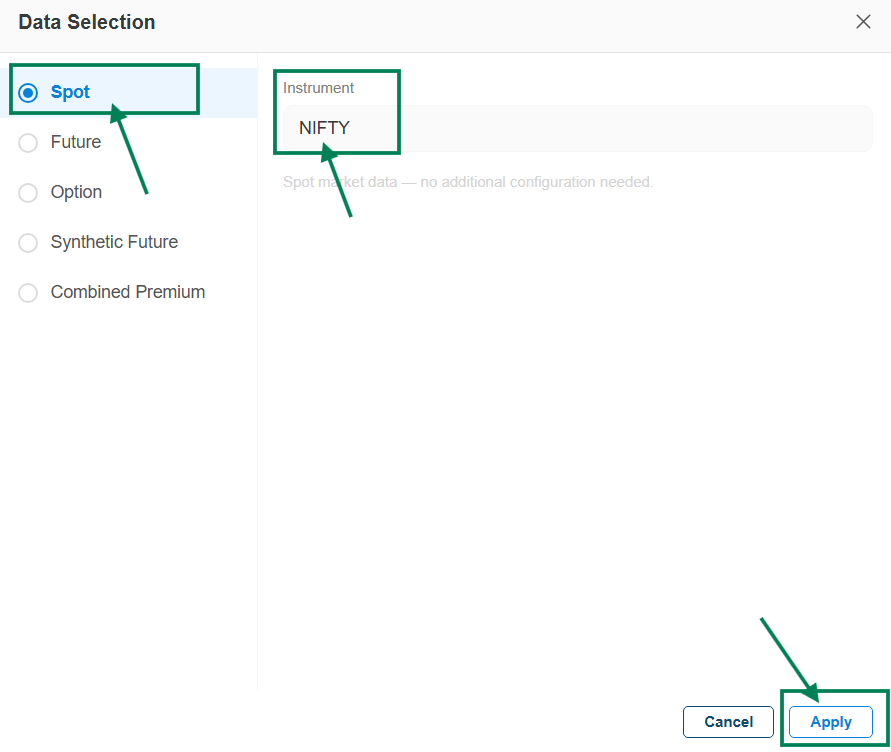
Step 2: Select the chart data
Click the data selection dropdown (it shows Spot by default), pick a data type, and click Apply.
Which data type should I use?
| Data type | Indicators run on | Best for | Available on |
|---|---|---|---|
| Spot | The underlying index/stock price | Most strategies; the standard choice | Indices, stocks, crypto |
| Futures | The futures contract price | Futures traders; futures price includes premium/discount vs spot | Indices, stocks, crypto |
| Options | A single option's premium (CE or PE) | Trading on option premium behavior (decay, IV moves) | Indices, stocks, crypto |
| Synthetic Futures | A futures like price derived from CE/PE combinations | Futures like signals without futures data | Indices, stocks |
| Combined Premium | The summed premium of multiple option legs (e.g., straddle CE+PE) | Volatility and premium decay strategies | Indices, stocks, crypto |
- Spot
- Futures
- Options
- Synthetic Futures
- Combined Premium
Indicators are applied to the underlying cash/index price - the simplest and most common setup.
- Select your instrument.
- Click the data selection dropdown, choose Spot, and click Apply.
Indicators are applied to the futures contract price. Futures can trade at a premium or discount to spot, so signals may differ from the spot chart.
- Select your instrument.
- Click the data selection dropdown and choose Future.
- Select the Expiry and click Apply.
Indicators run on a single option's premium instead of the underlying price. Option premiums are driven by the underlying move plus time decay (theta) and volatility (IV) - expect signals to differ substantially from spot.
- Select your instrument.
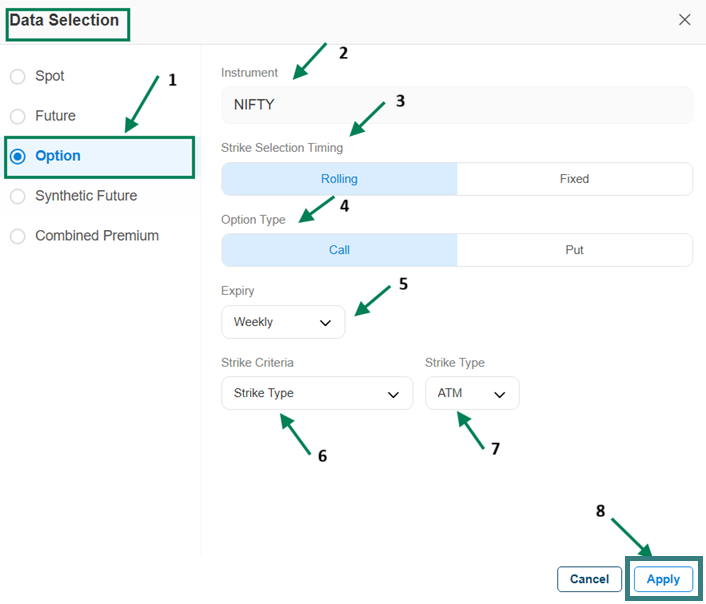
- Click the data selection dropdown and choose Options.
- Configure the option:
- Strike Selection Timing - Rolling (the strike updates whenever a different strike matches your criteria; indicators are evaluated on the current matching strike) or Fixed (the strike is locked once per day at a set time, e.g., 9:16, and all signals for the day are evaluated on that one strike - typical for intraday strategies).
- Option Type - Call (CE) or Put (PE).
- Expiry - Weekly, Next Weekly, Monthly, or Next Monthly.
- Strike Criteria - how the strike is chosen (e.g., ATM, ITM/OTM offsets, or Premium Range with lower/upper bounds).
- Click Apply.

For the full strike selection reference, see Strike Selection in the Leg Builder.
Indicators run on a synthetic futures price calculated from CE/PE option combinations - futures like behavior derived from the options market.
- Select your instrument.
- Click the data selection dropdown, choose Synthetic Future, and click Apply.

More detail: Synthetic Future reference.
Indicators run on the summed premium of multiple option legs - for example, an ATM straddle's CE + PE. Useful for volatility strategies (premium expands and contracts with market movement and IV).
- Select your instrument.
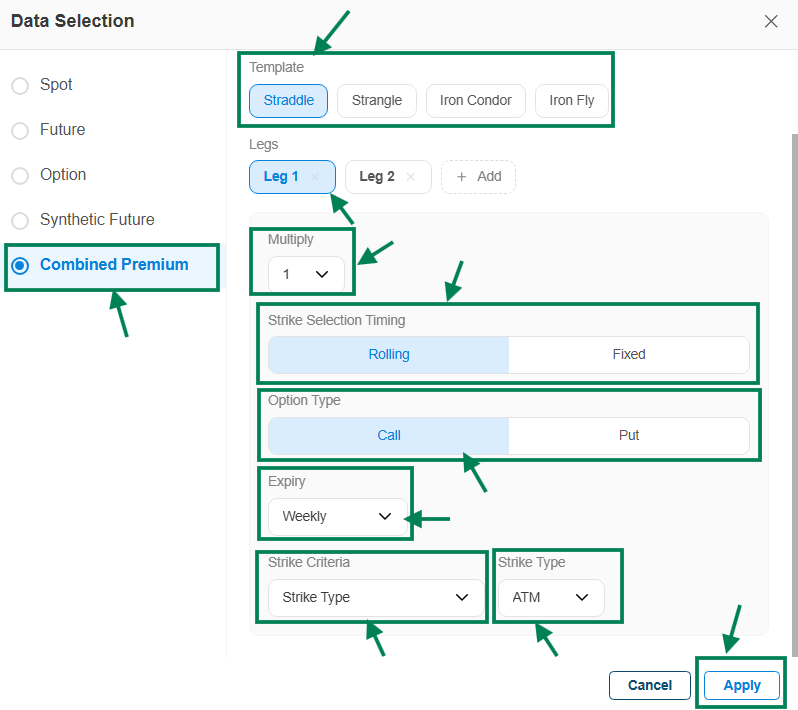
- Click the data selection dropdown and choose Combined Premium.
- Pick a Template — Straddle, Strangle, Iron Condor, or Iron Fly. Legs are created automatically; you can add or remove legs.
- Configure each leg: Option Type (CE/PE), Expiry, Strike Criteria, and Strike Type (ATM/ITM/OTM).
- Set Multiply (default 1) to scale the premium calculation if needed.
- Choose Strike Selection Timing - Rolling or Fixed (same meaning as on the Options tab).
- Click Apply.

Next steps
- Set signal limits to control how often your strategy trades
- Build your entry and exit conditions