Quickstart: Your First Signal in 10 Minutes
In this tutorial you'll build a classic EMA 20/50 crossover strategy on NIFTY, check it on the chart, backtest it, and deploy it as a paper trade. No real money is involved at any point.
What you'll need:
- An AlgoTest account with an active Signal Plan
- About 10 minutes
Backtesting (step 5) requires the 6-Month Signal Plan. If you're on the 1-Month plan, skip from step 4 straight to step 6 - everything else works the same.
Step 1: Open Signals AI
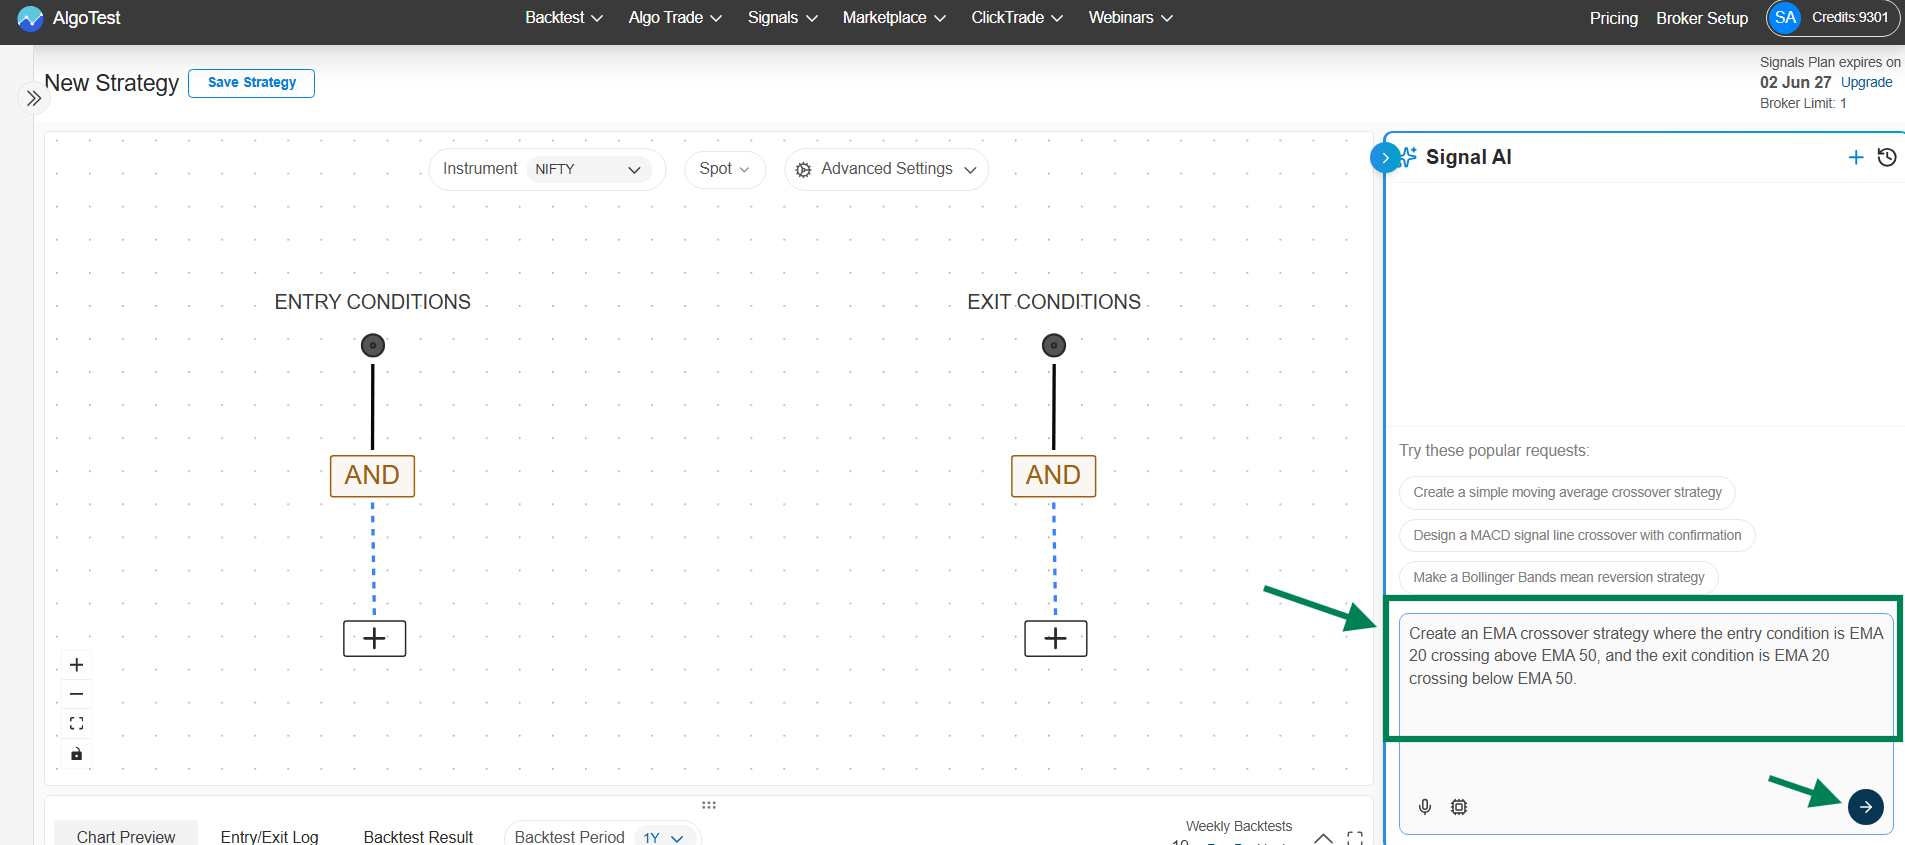
Log in to AlgoTest and go to Signals AI. You'll see the Canvas (the visual strategy builder) with the AI Agent chat panel.
Step 2: Describe your Signals Conditions
Type this into the AI Agent input box and press Enter:
Create an EMA crossover strategy where the entry condition is EMA 20 crossing above EMA 50, and the exit condition is EMA 20 crossing below EMA 50. Use the 5-minute timeframe on NIFTY spot.
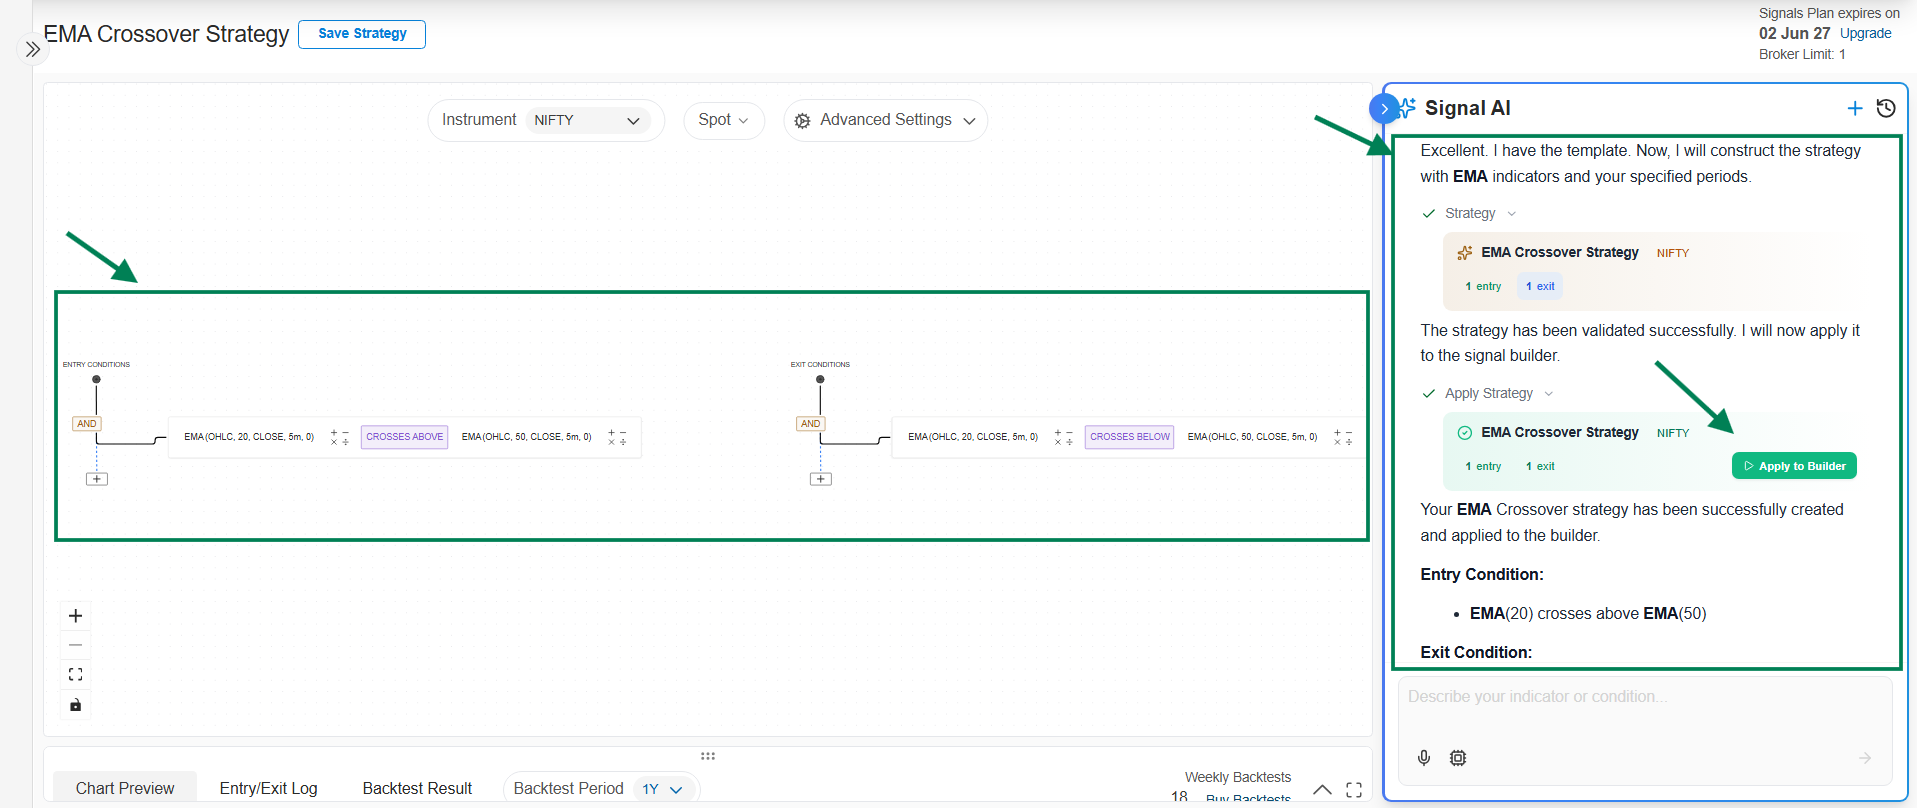
The AI builds the strategy and displays it on the Canvas:
A good prompt includes four things: the instrument (NIFTY), the chart data and timeframe (spot, 5-minute), the entry condition, and the exit condition. More tips in Using the AI Agent.
Step 3: Review the logic on the Canvas
The Canvas shows your strategy as connected blocks (nodes):
- Entry Conditions: EMA(20) crosses above EMA(50)
- Exit Conditions: EMA(20) crosses below EMA(50)
Click any node to inspect or change its settings - for example, the EMA period or timeframe. You can edit manually or just tell the AI what to change (e.g., "change the timeframe to 15 minutes"). See Building on the Canvas for the full node reference.
Step 4: Preview signals on the chart
Open the Chart Preview tab. Every point where your entry or exit condition fired is marked on the NIFTY price chart.
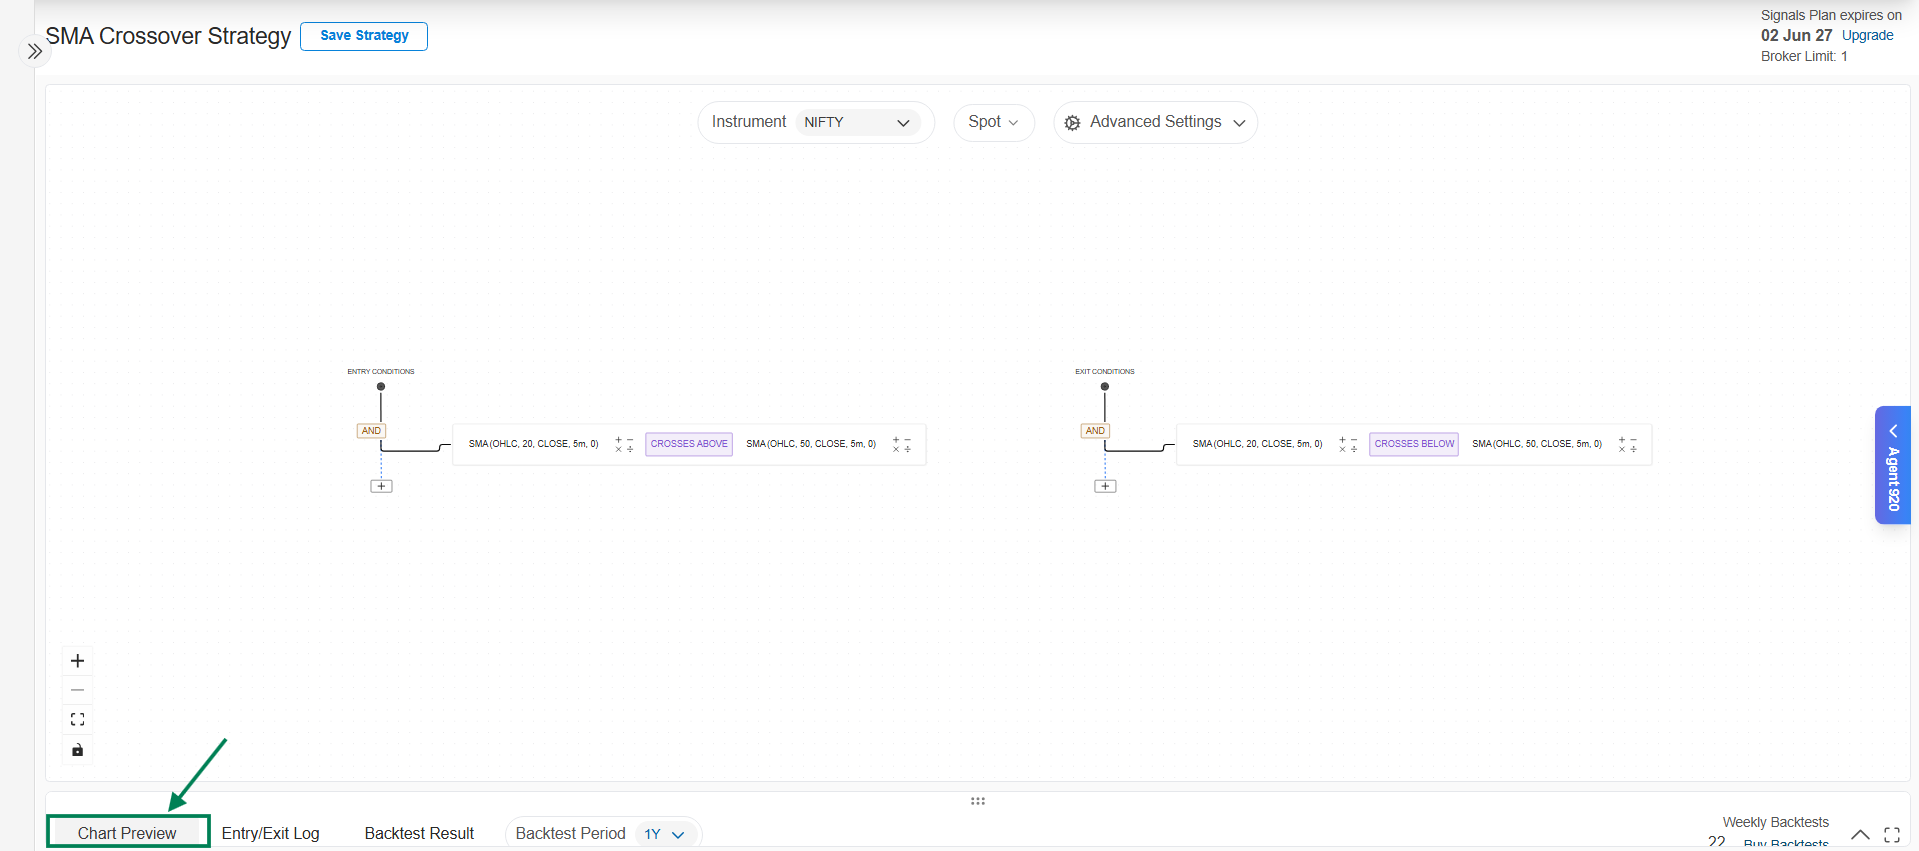
Check a few markers: does each entry sit where EMA 20 crossed above EMA 50? If something looks wrong, fix the logic before going further. The Entry & Exit Logs tab lists the same signals with exact timestamps.
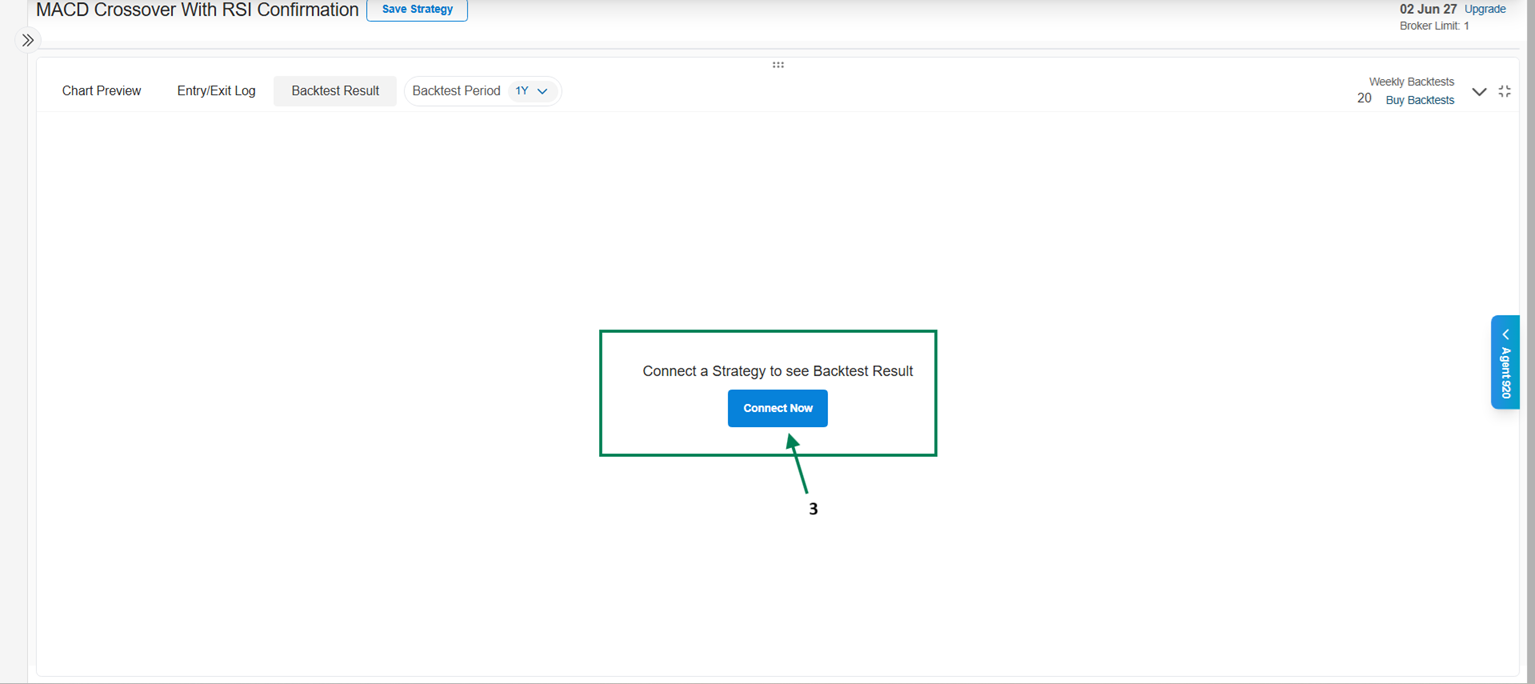
Step 5: Connect a trade and backtest
A signal only says when to act. To backtest, you also define what to trade when the signal fires (which option legs, how many lots, stop loss, target).
-
Click Backtest Result, then Connect Now.
-
Click Create Strategy. In the Strategy Builder, keep it simple for now: select NIFTY, and add one leg (e.g., sell an ATM Weekly Put, 1 lot). Click Save and Continue.
-
Select the Backtest Period and click Signal BackTest.
You'll get the full results: cumulative P&L, win rate, max drawdown, year-wise returns, and a downloadable trade log. How to read them is covered in Backtesting.
Step 6: Save the signal
Happy with the results? Click Save Strategy, give it a name (e.g., "EMA 20/50 NIFTY"), and save. It now appears in Saved Signals.
Step 7: Deploy as a Forward Test
A forward test runs your signals on live market data without real money - the safest way to validate it.
- Click Deploy Signal (or go to Signal → Signal Dashboard → Signals AI → Saved Signals).
- Find your signal and click Forward Test.
- The strategy moves to Signals AI → Forward Test and shows the Listening state - it's now watching live prices and will paper trade automatically when your conditions fire.
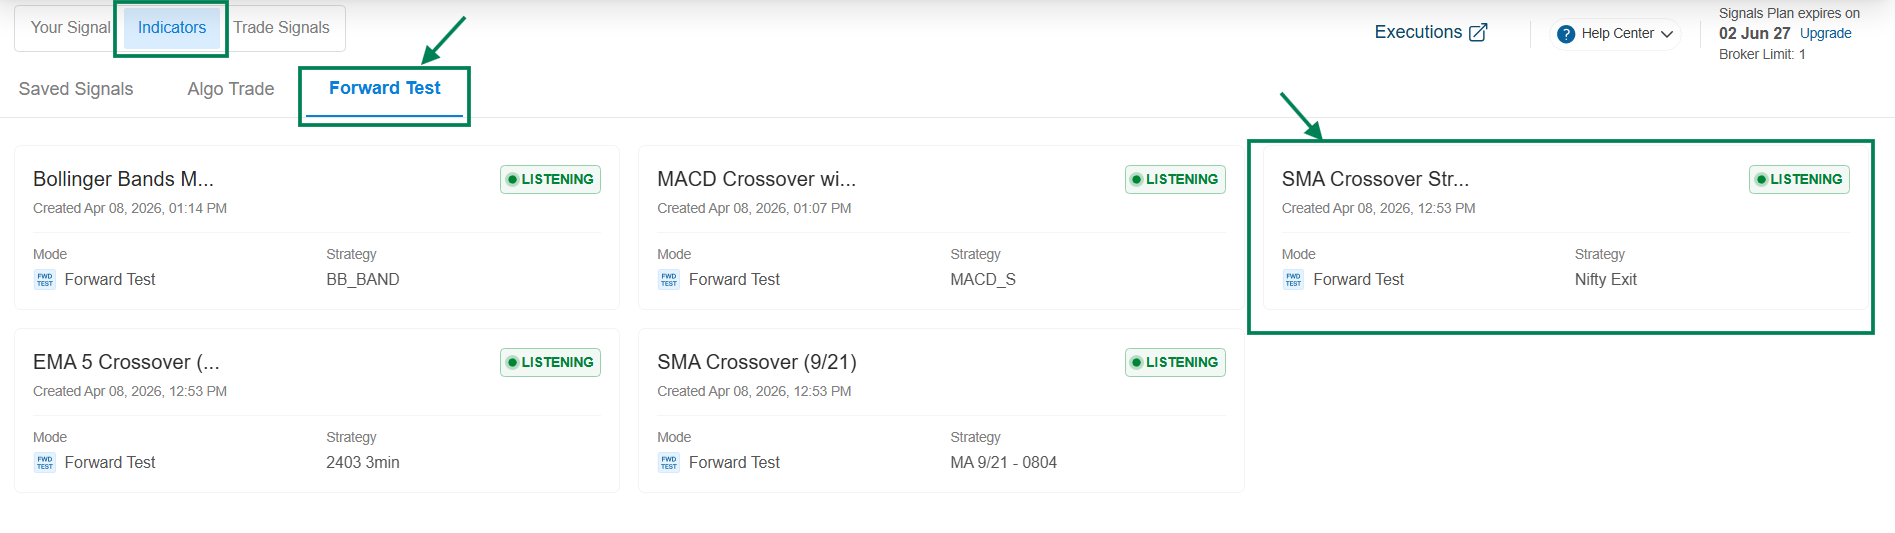
Listening means the strategy is active and monitoring live market data for your entry condition. You don't need to re-activate it each day. It stays listening until you pause or delete it. More in How Signals Work.
What's next
- Let it forward test for a few days, then review the results
- Ready for real trading? See Algo Trade - you'll need to connect a broker and configure Execution Settings first
- Explore all supported indicators to build more sophisticated strategies