Volatility & Range Indicators
These indicators measure how much price is moving (volatility) or track recent price extremes (range) - the building blocks for breakout strategies and volatility adjusted stops. For the shared parameters, see Indicator Parameters Explained.
1. Bollinger Bands
Three lines plotted around price:
- Middle Band - a moving average (typically 20-period)
- Upper Band - middle band + N standard deviations (default 2)
- Lower Band - middle band − N standard deviations
The bands widen when volatility rises and narrow when it falls. Price near the upper band suggests overbought; near the lower band, oversold. Price above/below the middle band indicates the trend direction.
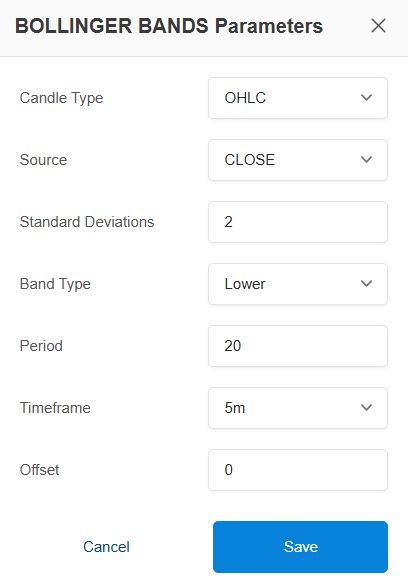
Parameters:
| Parameter | Default | Description |
|---|---|---|
| period | 20 | Lookback for the middle band |
| standard_deviations | 2 | Band width - higher = wider bands, fewer signals; lower = tighter bands, more signals |
| band_type | — | Which band the condition uses: Upper, Middle, or Lower |
| source / candle_type / timeframe / offset | — | Standard |

Example strategy - breakout (trending markets):
| Condition | |
|---|---|
| Entry | Close crosses above the Upper Band - breakout with strong upward momentum |
| Exit | Close crosses below the Lower Band |
The breakout strategy above suits trending markets. In ranging markets, traders often invert the logic - buy at the lower band, exit at the upper band (mean reversion). Know which market you're in, or filter with ADX.
2. ATR (Average True Range)
Measures volatility only - how much price moves on average per candle over the period. It says nothing about direction.
Common uses:
- Trailing stops - a stop placed N × ATR away adapts automatically: wider in volatile markets, tighter in calm ones
- Position sizing - high ATR → smaller position to keep risk constant
Parameters:
| Parameter | Default | Description |
|---|---|---|
| period | 14 | Shorter (e.g., 5) reacts faster to volatility changes; longer (e.g., 20) is smoother |
| candle_type / timeframe / offset | — | Standard |

Example strategy - SMA entry with ATR trailing stop:
| Condition | |
|---|---|
| Entry | Close crosses above SMA(20) |
| Exit | Close crosses below (SMA(20) − 2 × ATR(14)) — a volatility-adjusted trailing stop |
3. Min Max
Tracks the highest (MAX) or lowest (MIN) value of a price source over a lookback period - the recent extremes that define support/resistance. This is the standard building block for price channel breakout strategies.
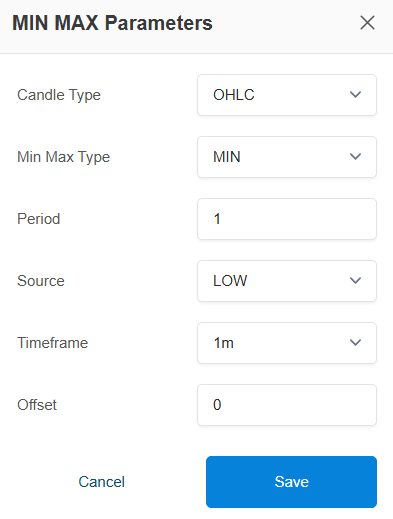
Parameters:
| Parameter | Description |
|---|---|
| min_max_type | MIN (lowest value in the period) or MAX (highest value in the period) |
| period | How many candles to look back (e.g., 20) |
| source | Price point used - e.g., HIGH for breakout highs, LOW for breakdown lows |
| candle_type / timeframe / offset | Standard |
Example strategy - price channel breakout:
| Condition | |
|---|---|
| Entry | Close crosses above MAX(HIGH, 20) - price breaks its 20 candle high |
| Exit | Close crosses below MIN(LOW, 10) - price breaks its 10 candle low |