Trend Indicators
Trend indicators identify the direction and strength of a price trend. Each section below covers what the indicator does, its parameters, and an example strategy you can build (or paste into the AI Agent).
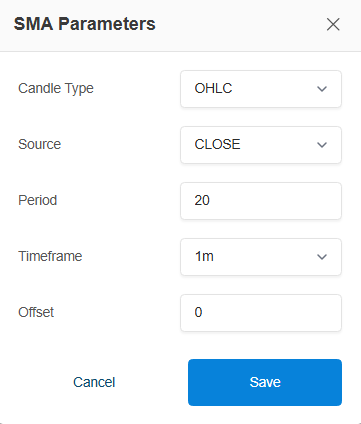
For Candle Type, Source, Period, Timeframe, and Offset - common to all indicators - see Indicator Parameters Explained.
1. EMA (Exponential Moving Average)
A moving average that weights recent prices more heavily, making it more responsive to current market changes than an SMA.
- Identifies short term trends and momentum
- Acts as dynamic support and resistance
- The classic crossover pair (fast EMA × slow EMA) is one of the most used entry signals
Parameters: Candle Type, Source, Period, Timeframe, Offset - all standard.

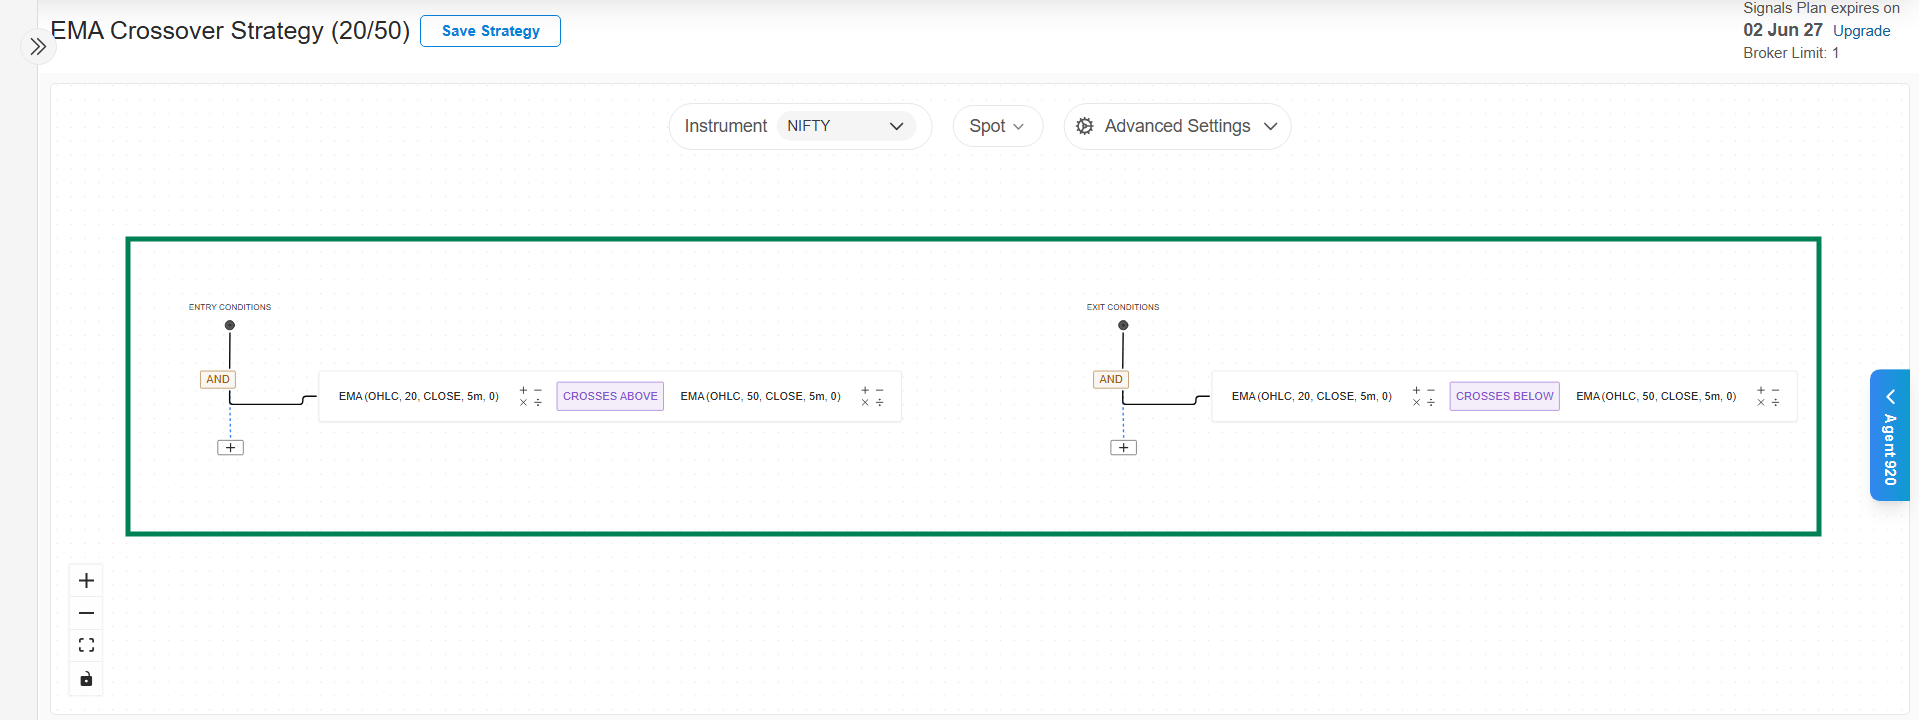
Example strategy - EMA 20/50 crossover:
| Condition | |
|---|---|
| Entry | EMA(20) crosses above EMA(50), 5m timeframe |
| Exit | EMA(20) crosses below EMA(50) |
For the click-by-click build, see the Canvas worked example or the Quickstart.
2. SMA (Simple Moving Average)
The average price over a period, with all candles weighted equally. Smoother and slower than EMA - better for trend confirmation, support/resistance, and longer term direction.
Parameters: standard set.
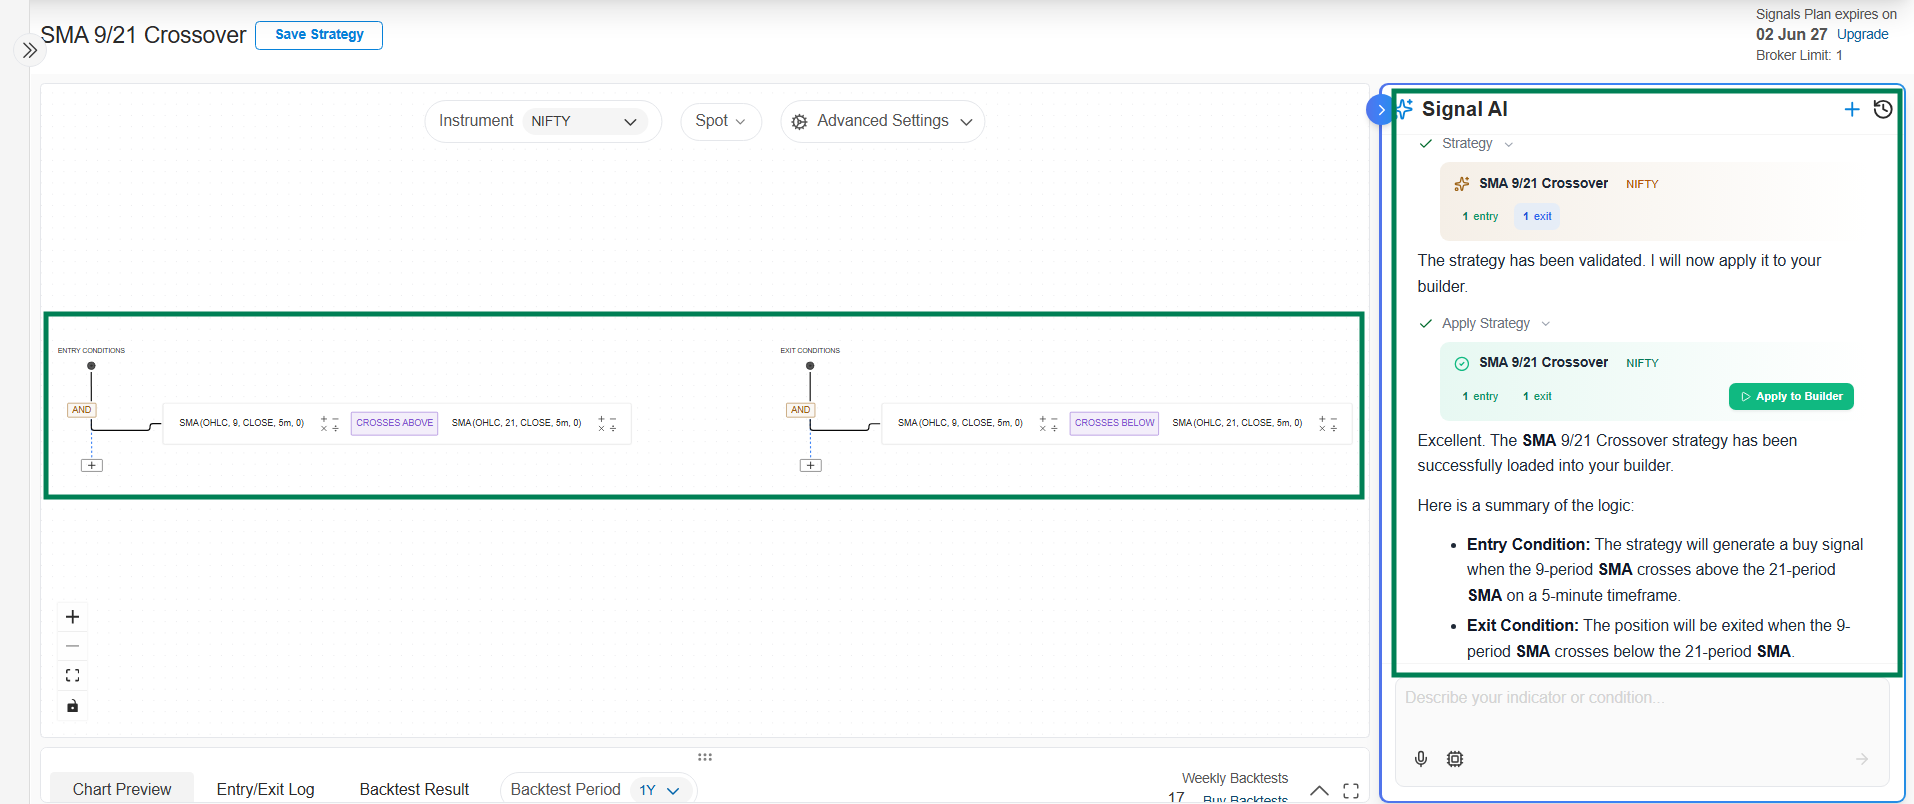
Example strategy - SMA 9/21 crossover (NIFTY, 5m):
| Condition | |
|---|---|
| Entry | SMA(9) crosses above SMA(21) |
| Exit | SMA(9) crosses below SMA(21) |
3. WMA (Weighted Moving Average)
Like SMA, but weights recent prices more heavily (linearly), making it more responsive to new information.
Parameters: standard set.

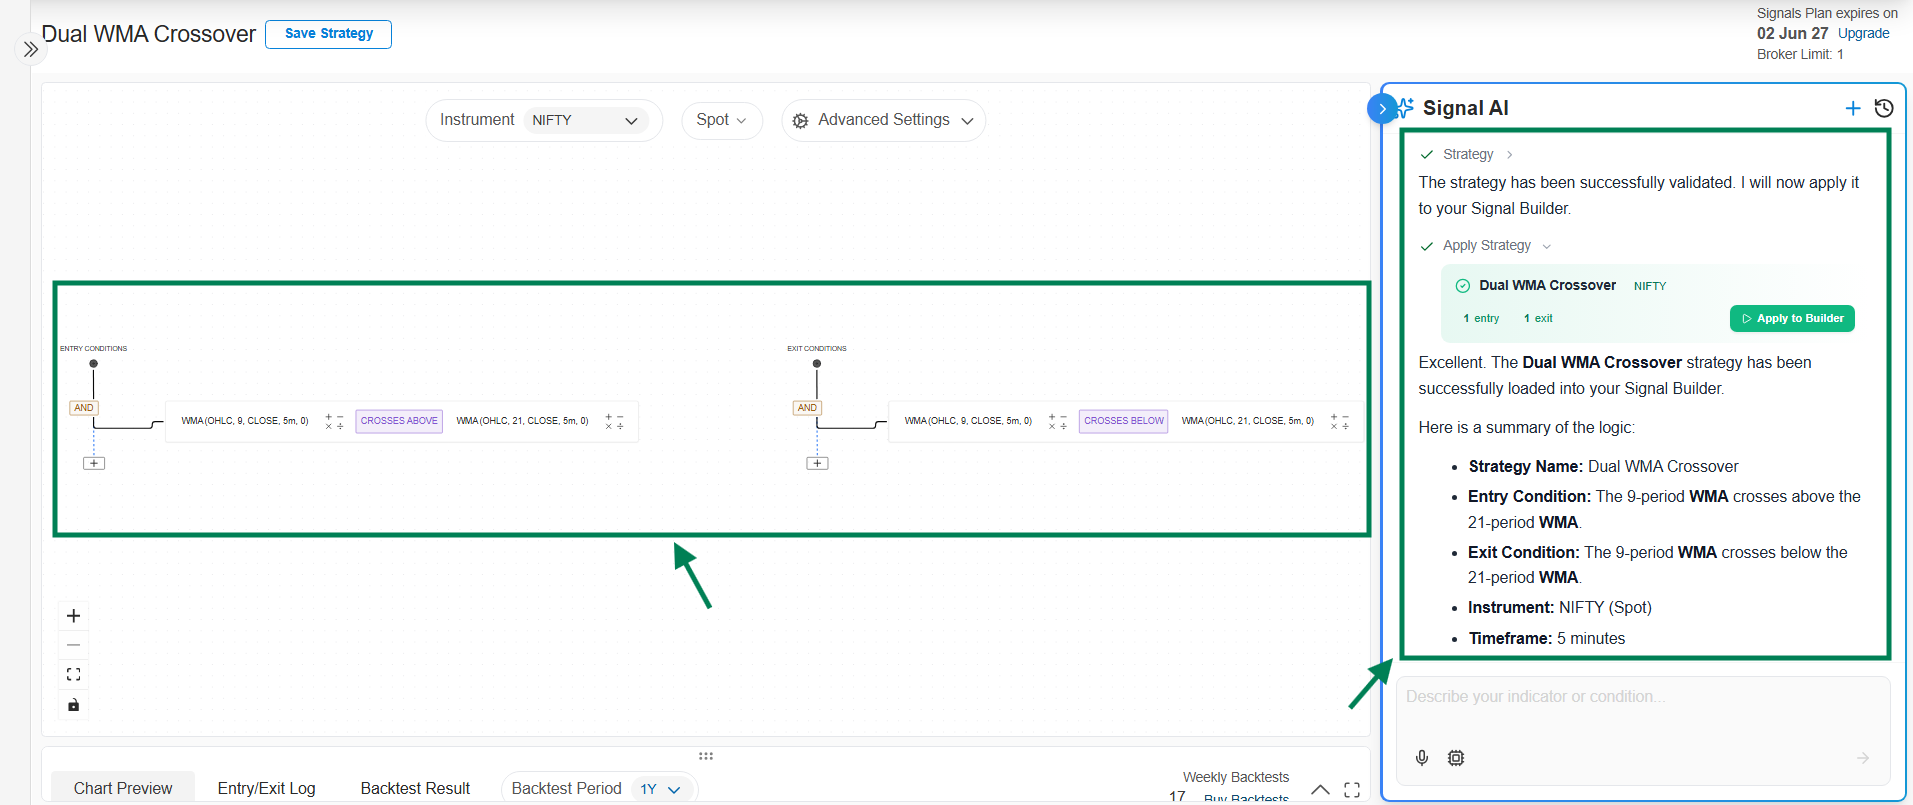
Example strategy - Dual WMA crossover (NIFTY spot, 5m):
| Condition | |
|---|---|
| Entry | WMA(9) crosses above WMA(21) |
| Exit | WMA(9) crosses below WMA(21) |
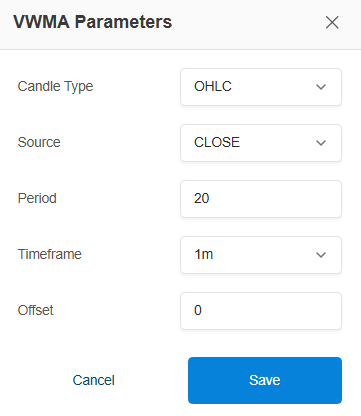
4. VWMA (Volume Weighted Moving Average)
A moving average that weights price by trading volume - price moves on high volume count for more. Often more reliable for trend confirmation than a plain SMA, because volume backed moves are more significant.
Parameters: standard set.
Example strategy - price crossover:
| Condition | |
|---|---|
| Entry | Close crosses above VWMA(20) - upward momentum confirmed by volume |
| Exit | Close crosses below VWMA(20) |
5. Supertrend
A trend-following indicator built on ATR (volatility). The line flips sides when the trend changes: below price = uptrend (typically green), above price = downtrend (typically red).
Parameters:
| Parameter | Default | Description |
|---|---|---|
| Period | 10 | ATR lookback period |
| Multiplier | 3 | Distance of the line from price. Higher = fewer, more reliable signals; lower = more, noisier signals |
| Candle Type, Timeframe, Offset | — | Standard |

Example strategy - Supertrend flip (NIFTY spot, 5m):
| Condition | |
|---|---|
| Entry | Close crosses above Supertrend(10, 3) |
| Exit | Close crosses below Supertrend(10, 3) |
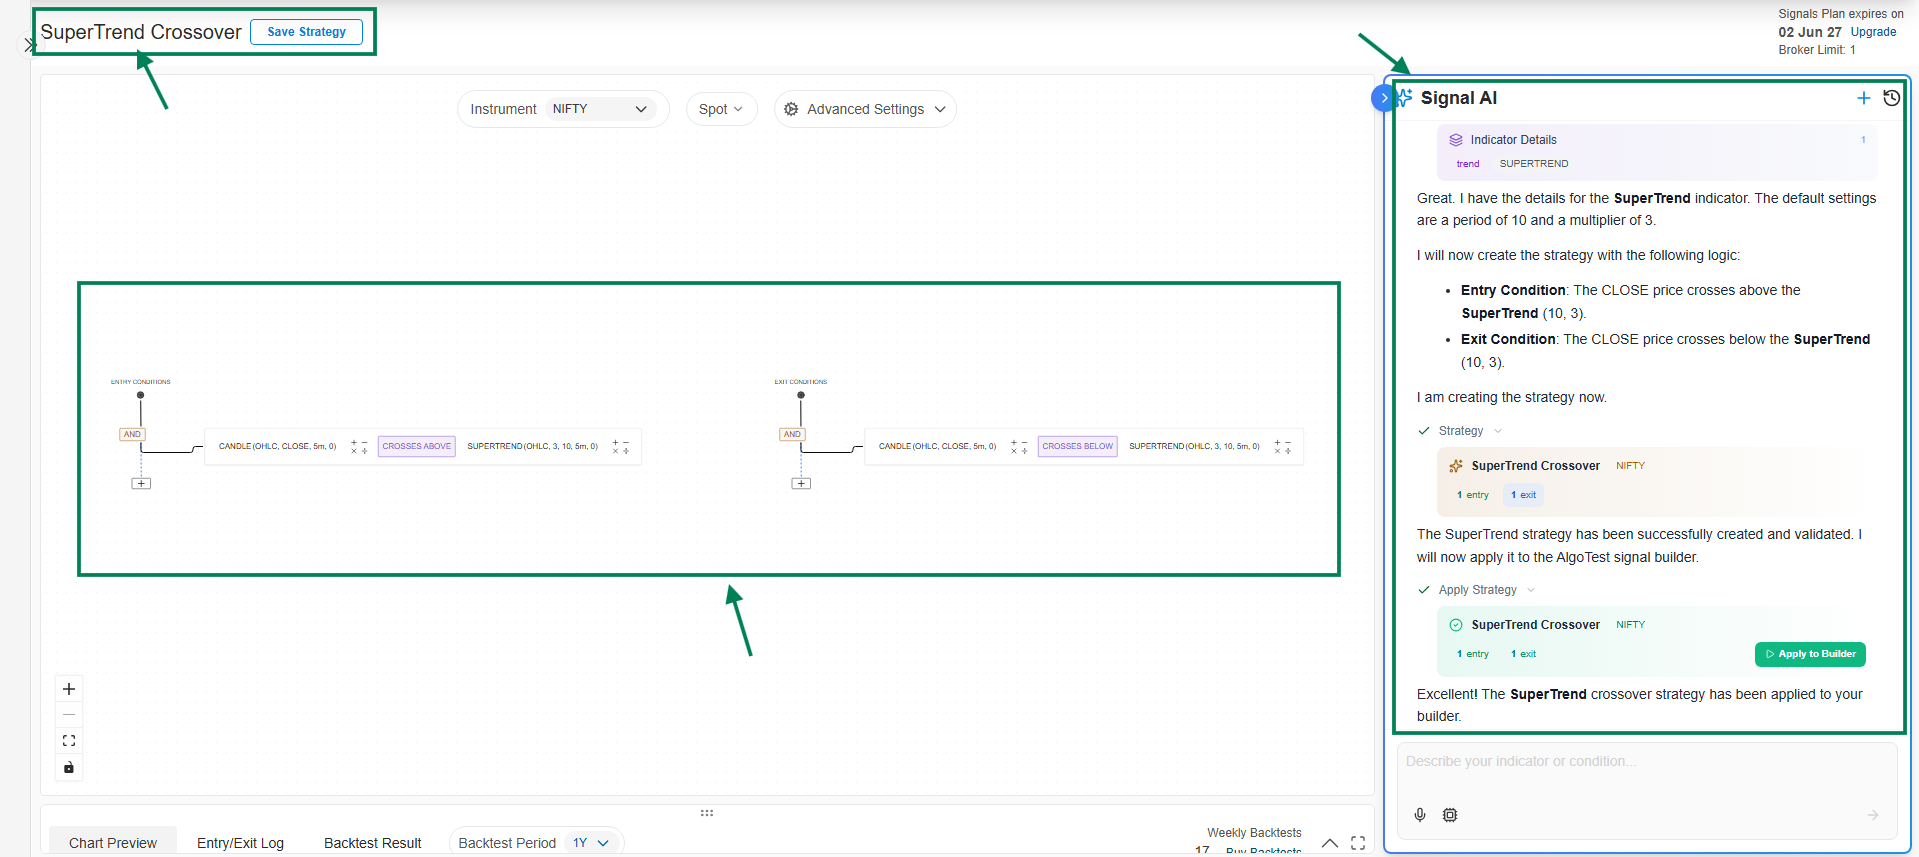
Supertrend shines in trending markets but produces false flips in sideways markets. Pair it with a trend strength filter like ADX for confirmation.
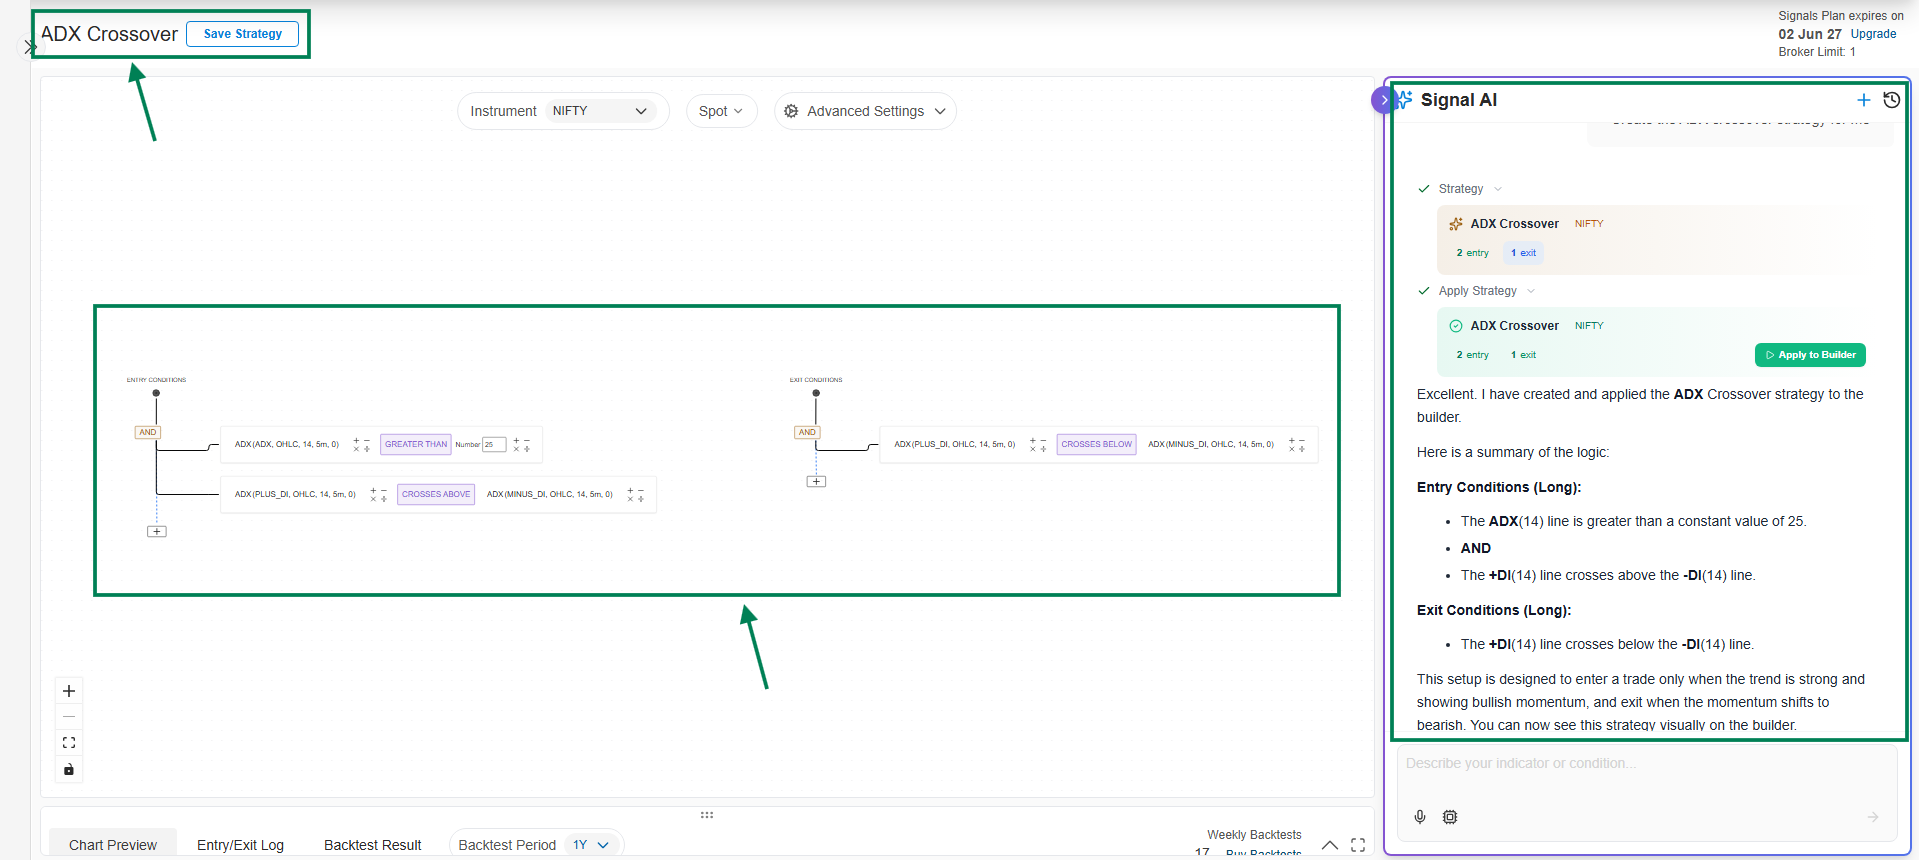
6. ADX (Average Directional Index)
Measures the strength of a trend, not its direction. Three lines:
- ADX - trend strength. Above 25 = strong trend; below 20 = weak/ranging market.
- +DI - strength of upward movement
- -DI - strength of downward movement
Use ADX to filter out trades in choppy markets, and the DI crossover for direction.
Parameters:
| Parameter | Default | Description |
|---|---|---|
| period | 14 | Lookback period |
| adx_component | ADX | Which line the condition uses: ADX, PLUS_DI, or MINUS_DI |
Example strategy - ADX filtered DI crossover (NIFTY, 5m):
| Condition | |
|---|---|
| Entry | ADX(14) > 25 AND +DI(14) crosses above -DI(14) |
| Exit | +DI(14) crosses below -DI(14) |
7. VWAP (Volume Weighted Average Price)
The day's average price weighted by volume; resets each trading day. Institutional traders use it as a fair value benchmark: price above VWAP = bullish for the session, below = bearish. Intraday only.
Parameters: Source (the standard formula uses HLC3; other sources selectable). Optional standard deviation bands can be added around the line.
Example strategy - VWAP crossover (intraday):
| Condition | |
|---|---|
| Entry | Close crosses above VWAP |
| Exit | Close crosses below VWAP |
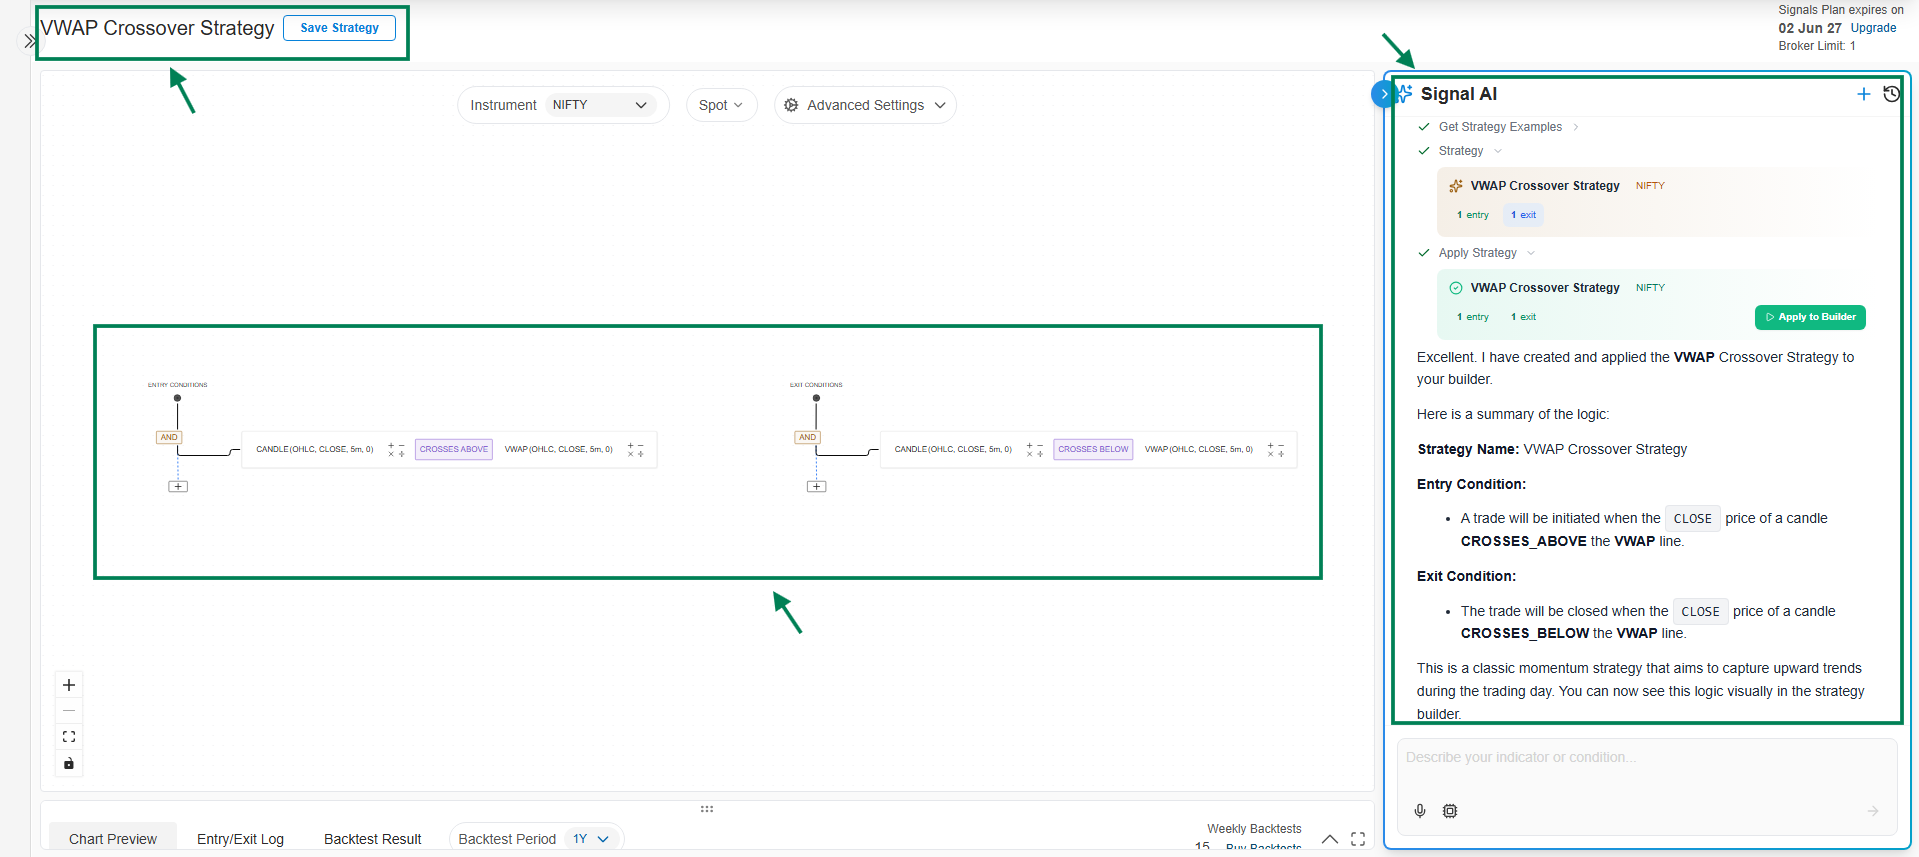
VWAP or VWMA doesn't work with Spot chart for indexes as no volume is available in spot charts.