Momentum Indicators
Momentum indicators measure the speed and strength of price moves, and help spot overbought/oversold conditions and reversals. For the shared parameters (Candle Type, Source, Period, Timeframe, Offset), see Indicator Parameters Explained.
1. RSI (Relative Strength Index)
An oscillator between 0 and 100 measuring the speed and change of price movements.
- Above 70 - overbought; potential pullback
- Below 30 - oversold; potential bounce
- Divergence (price makes a new high but RSI doesn't) signals weakening momentum
Parameters:
| Parameter | Default | Description |
|---|---|---|
| period | 14 | Shorter = more sensitive; longer = smoother |
| source | CLOSE | Standard |
| candle_type | OHLC | OHLC or HEIKIN_ASHI |

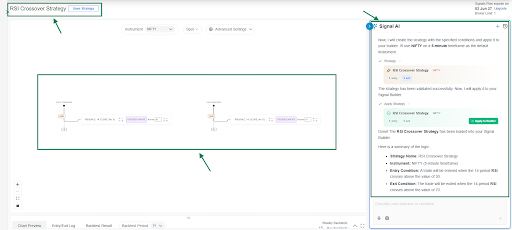
Example strategy - RSI crossover (NIFTY, 5m):
| Condition | |
|---|---|
| Entry | RSI(14) crosses above 30 - bearish momentum fading |
| Exit | RSI(14) crosses above 70 - market likely due a pullback |
2. MACD (Moving Average Convergence Divergence)
A trend-following momentum indicator with three components:
- MACD Line - fast EMA (12) minus slow EMA (26): short term momentum
- Signal Line - 9-period EMA of the MACD Line: the trigger line
- Histogram - MACD Line minus Signal Line: positive = bullish momentum, negative = bearish
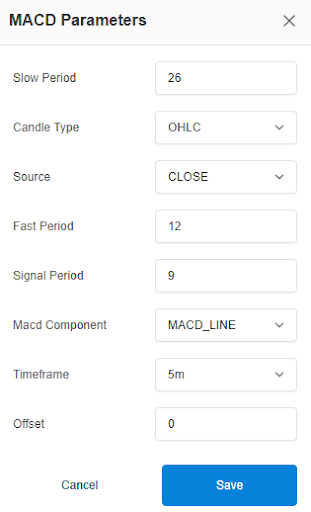
Parameters:
| Parameter | Default | Description |
|---|---|---|
| fast_period | 12 | Fast EMA period |
| slow_period | 26 | Slow EMA period |
| signal_period | 9 | Signal line EMA period |
| source | CLOSE | Price source |
| macd_component | MACD_LINE | Which output the condition uses: MACD_LINE, SIGNAL_LINE, or HISTOGRAM |
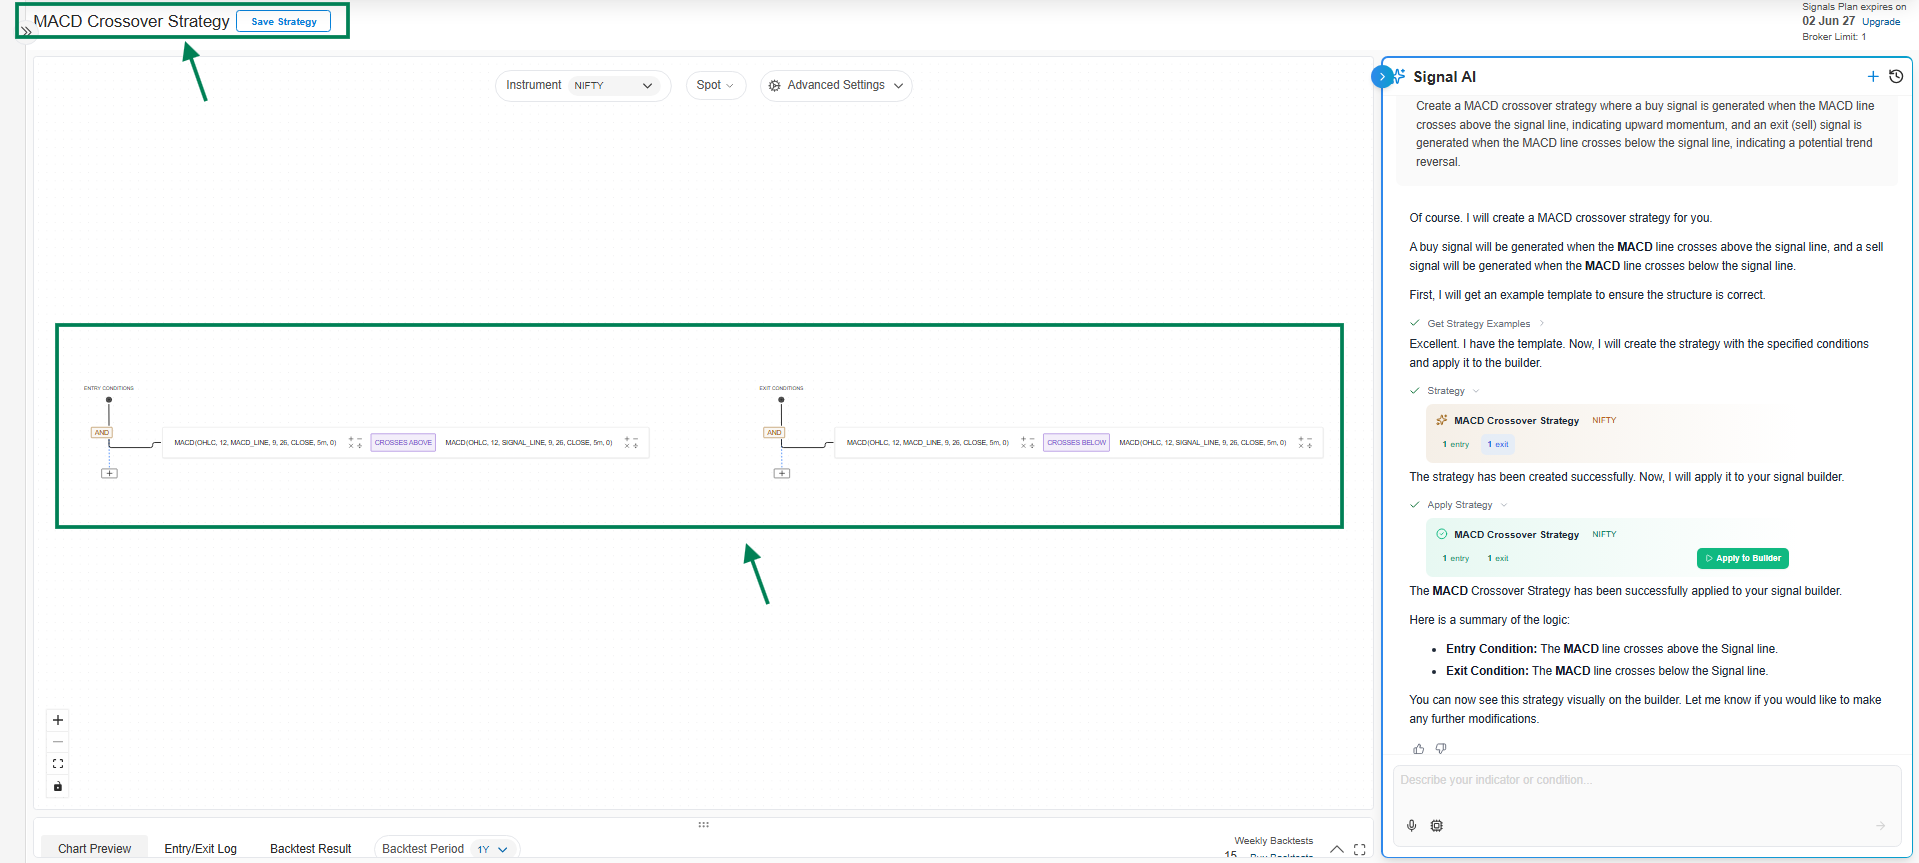
Example strategy - MACD crossover:
| Condition | |
|---|---|
| Entry | MACD Line crosses above Signal Line |
| Exit | MACD Line crosses below Signal Line |
3. Stochastic Oscillator
Compares the current close to the recent high-low range, on a 0 to 100 scale. The idea: momentum shifts before price does.
- %K - the main line
- %D - moving average of %K (the signal line)
- Above 80 = overbought, below 20 = oversold
Parameters:
| Parameter | Default | Description |
|---|---|---|
| k_period | 14 | Lookback for %K |
| d_period | 3 | Smoothing for %D |
| stochastic_line | — | Which line the condition uses: %K or %D |

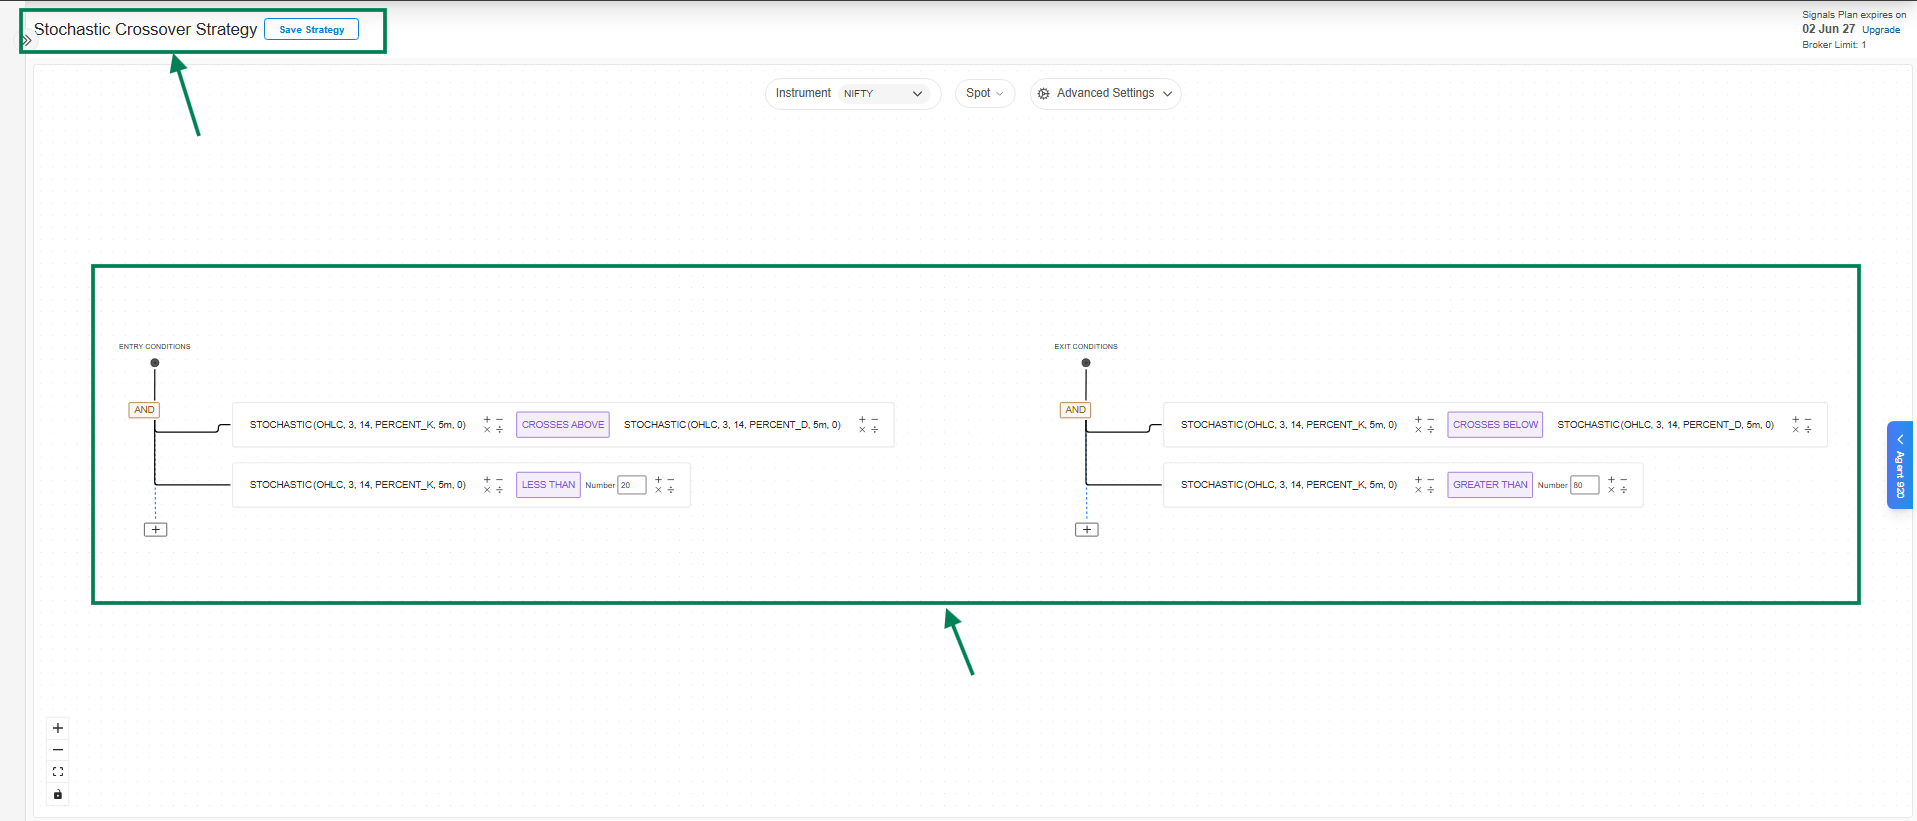
Example strategy - %K/%D crossover:
| Condition | |
|---|---|
| Entry | %K crosses above %D (strongest when both are below 20) |
| Exit | %K crosses below %D (strongest when both are above 80) |
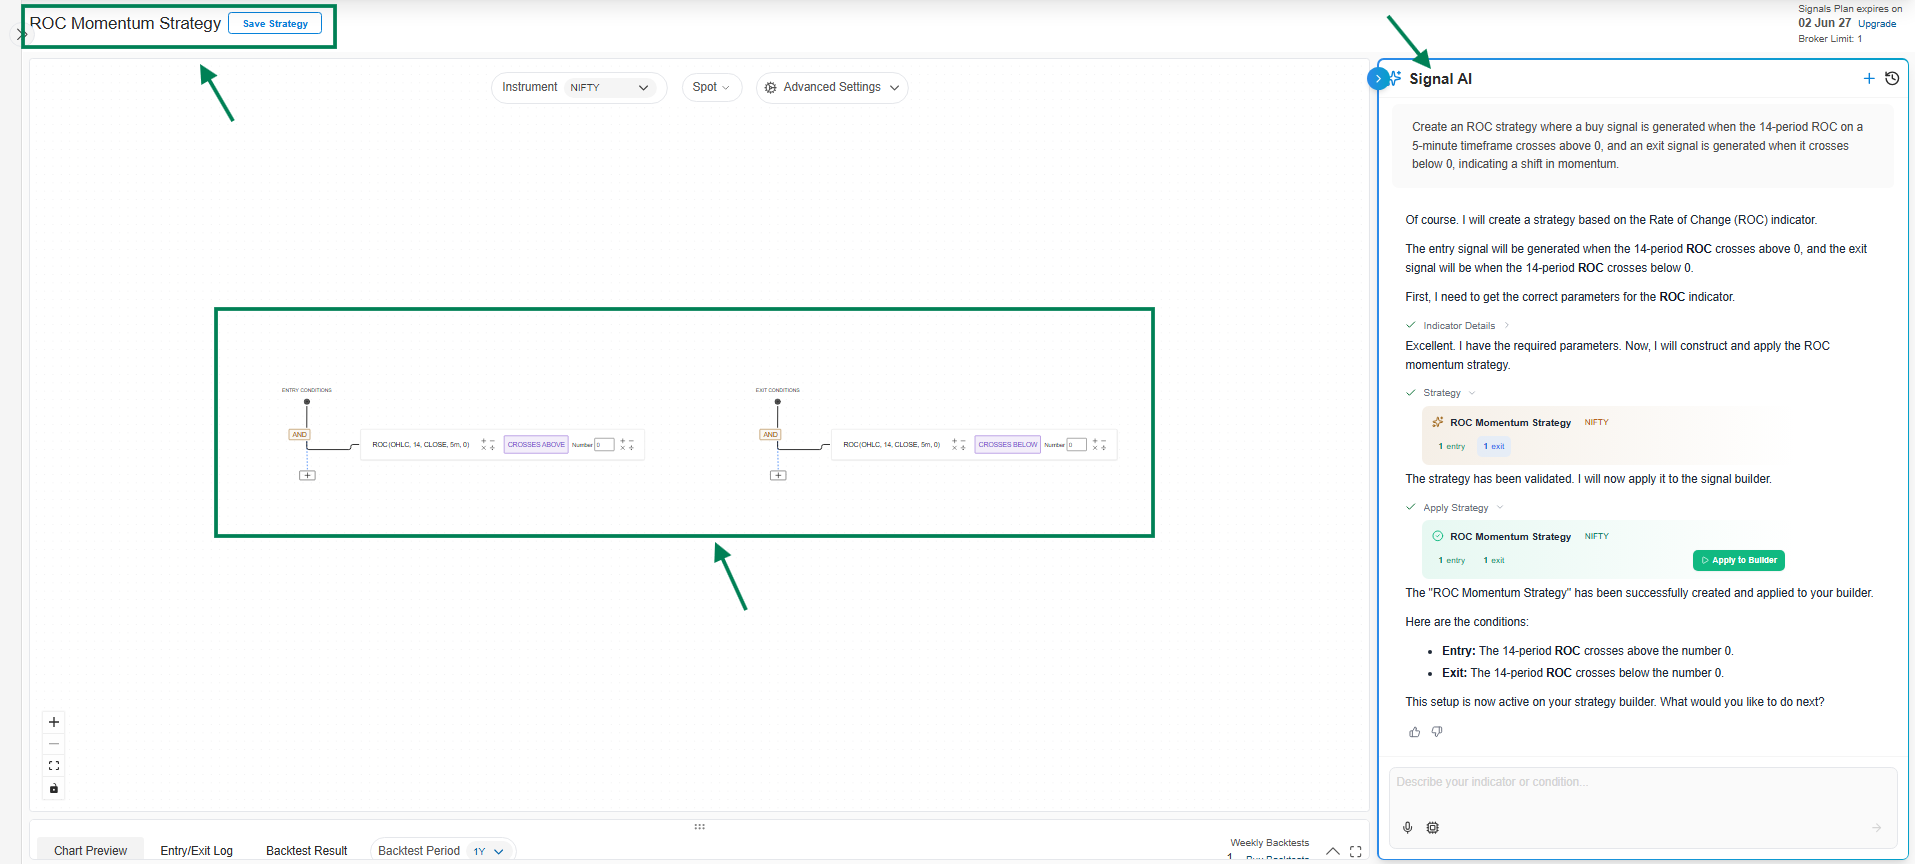
4. ROC (Rate of Change)
The percentage change between the current price and the price N periods ago: ((Price − Price N ago) / Price N ago) × 100. Oscillates around a zero line - positive = bullish momentum, negative = bearish. A zero line cross signals a potential trend change.
Parameters:
| Parameter | Default | Description |
|---|---|---|
| period | 14 | Lookback period |
| source | CLOSE | Price source |
| candle_type | OHLC | OHLC or HEIKIN_ASHI |

Example strategy - zero line crossover (5m):
| Condition | |
|---|---|
| Entry | ROC(14) crosses above 0 - momentum turns positive |
| Exit | ROC(14) crosses below 0 - momentum turns negative |
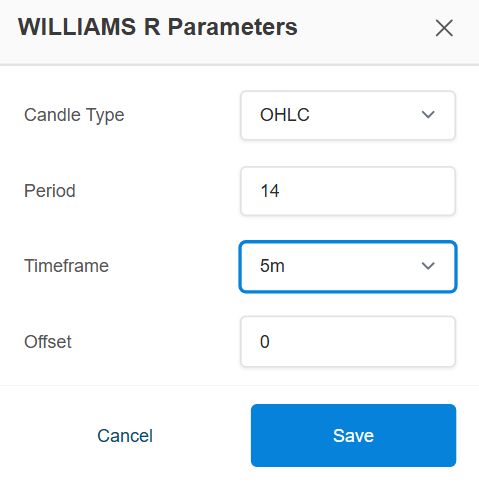
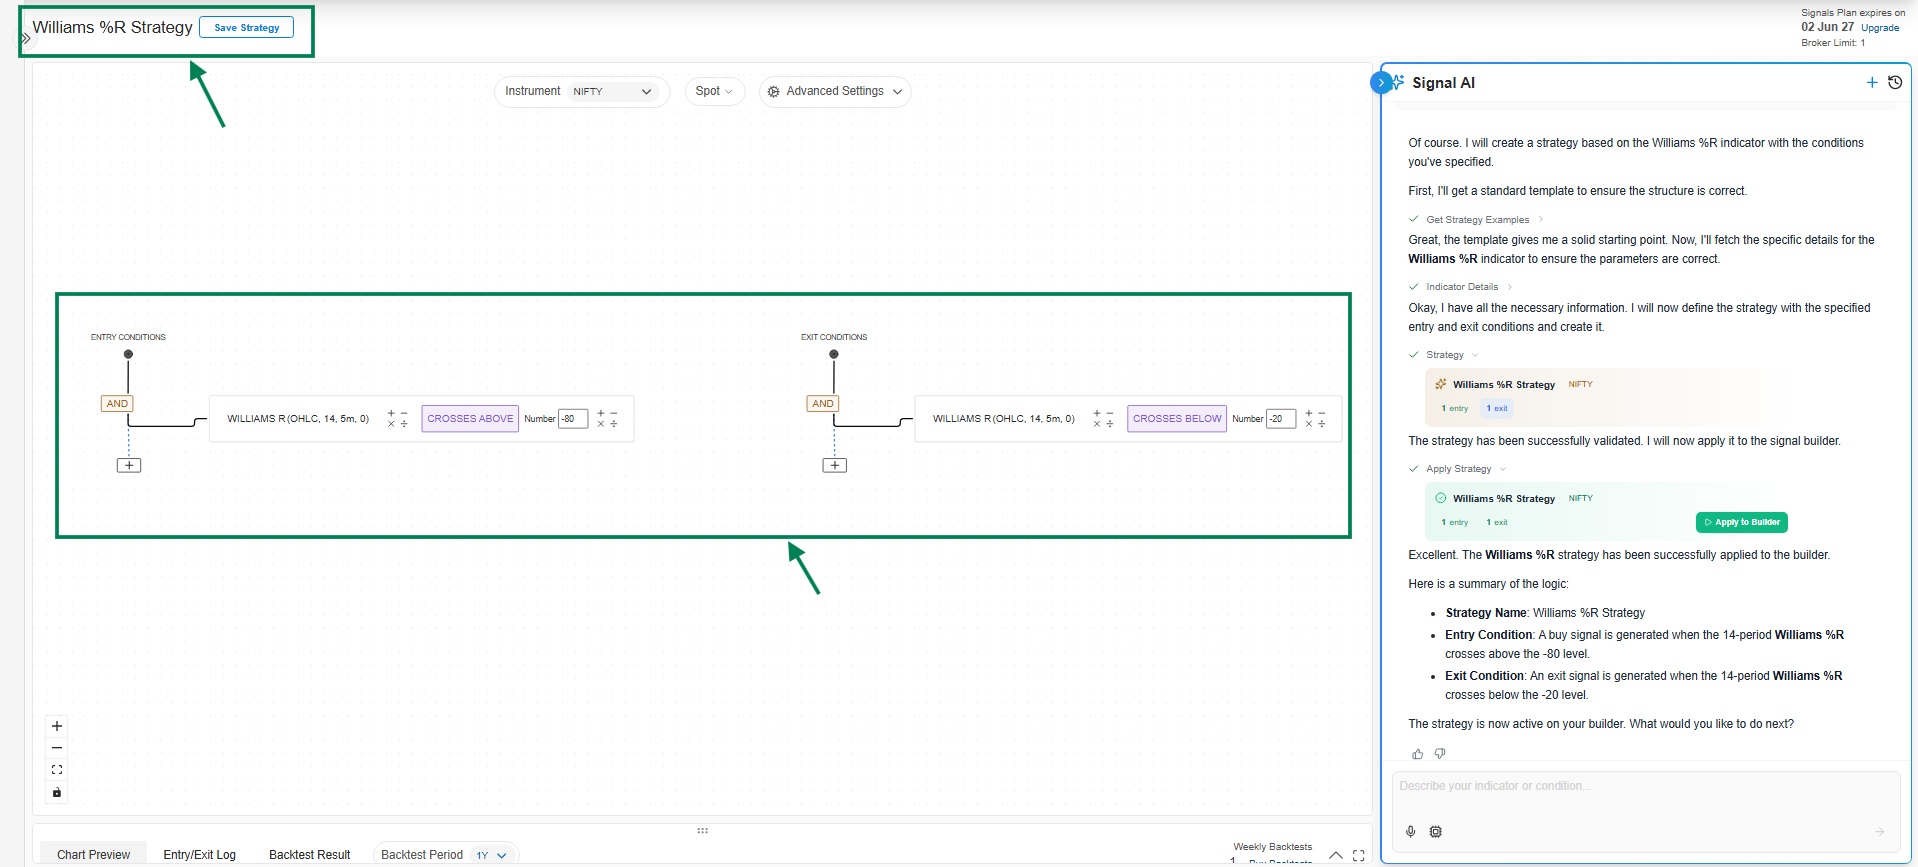
5. Williams %R
A momentum oscillator on a negative scale from 0 to -100 (similar to Stochastic):
- -20 to 0 - overbought: price near the top of its recent range
- -80 to -100 - oversold: price near the bottom of its recent range
Parameters:
| Parameter | Default | Description |
|---|---|---|
| period | 14 | Shorter (e.g., 7) = more signals; longer (e.g., 21) = fewer, more reliable |
| candle_type | OHLC | OHLC or HEIKIN_ASHI |
Example strategy - mean reversion:
| Condition | |
|---|---|
| Entry | Williams %R(14) crosses above -80 - leaving oversold territory |
| Exit | Williams %R(14) crosses below -20 - leaving overbought territory |
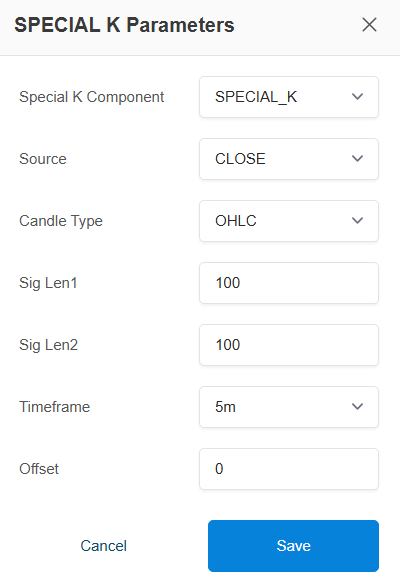
6. Special K
Martin Pring's composite oscillator that sums multiple ROC calculations across short, intermediate, and long lookbacks, smoothed by moving averages. Designed to identify primary trend reversals while filtering short-term noise.
- Rising Special K = bullish momentum; falling = bearish
- Crossing its signal line generates buy/sell signals
- Divergence vs price is a strong reversal warning
Parameters:
| Parameter | Description |
|---|---|
| special_k_component | SPECIAL_K (the main line) or SIGNAL_LINE (smoothed confirmation line) |
| source | Price source (Close is typical) |
| candle_type | OHLC or HEIKIN_ASHI |
| sig_len1 | Primary lookback — lower = faster signals, higher = smoother |
| sig_len2 | Secondary smoothing — higher = more stable, slower |
| timeframe / offset | Standard |
Example strategy - Special K crossover:
| Condition | |
|---|---|
| Entry | SPECIAL_K crosses above SIGNAL_LINE |
| Exit | SPECIAL_K crosses below SIGNAL_LINE |