Indicator Parameters Explained
Almost every indicator in Signals AI shares the same five core parameters. This page explains them once - individual indicator pages only cover what's unique to each indicator.
Candle Type
The type of candles used in the calculation.

- OHLC (default) - standard candlesticks.
- HEIKIN_ASHI - smoothed candles that filter out noise, useful for cleaner trend identification.
Source
Which price point of each candle the calculation uses.

Single price points:
| Source | What it is | When to use it |
|---|---|---|
| Close (default) | Final price of the period | The standard choice - the close represents the period's final consensus of value |
| Open | First price of the period | Opening range breakout style strategies |
| High | Highest price of the period | An average of Highs runs above price - useful as dynamic resistance |
| Low | Lowest price of the period | An average of Lows runs below price - useful as dynamic support |
Averaged price points (smoother, less affected by single price spikes):
| Source | Formula | Notes |
|---|---|---|
| OHLC4 | (O + H + L + C) / 4 | The "mean price" of the whole candle |
| HLC3 | (H + L + C) / 3 | The "typical price" - used inside indicators like CCI |
| HL2 | (H + L) / 2 | The midpoint of the range; ignores open and close |
Period
The lookback window - how many candles the calculation uses.

- Shorter period (e.g., 10, 20) → reacts quickly to price changes, tracks price closely, more signals (and more noise).
- Longer period (e.g., 50, 200) → smoother, less sensitive, fewer but steadier signals.
Timeframe
The chart interval the indicator is calculated on - 1m, 5m, 15m, 1H, etc.
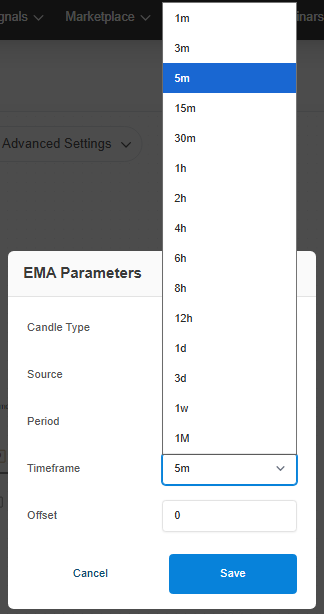
Lower timeframes give more signals; higher timeframes give fewer signals that reflect larger moves. Conditions in one strategy can mix timeframes (e.g., enter on 5m only when the 1H trend agrees).
Offset
Looks back at the indicator's value from N candles ago - "what was this indicator's value N candles back?"

- 0 - the current, still forming candle
- 1 - the most recently completed candle
- 2 - the candle before that, and so on
Useful for conditions like "RSI was below 30 on the previous candle and is above 30 now."
Indicator specific parameters
Some indicators add their own parameters - for example Supertrend's Multiplier, MACD's fast/slow/signal periods, or Bollinger Bands' standard deviations. These are documented on each indicator's page:
- Trend Indicators — EMA, SMA, WMA, VWMA, Supertrend, ADX, VWAP
- Momentum Indicators — RSI, MACD, Stochastic, ROC, Williams %R, Special K
- Volatility & Range Indicators — Bollinger Bands, ATR, Min Max