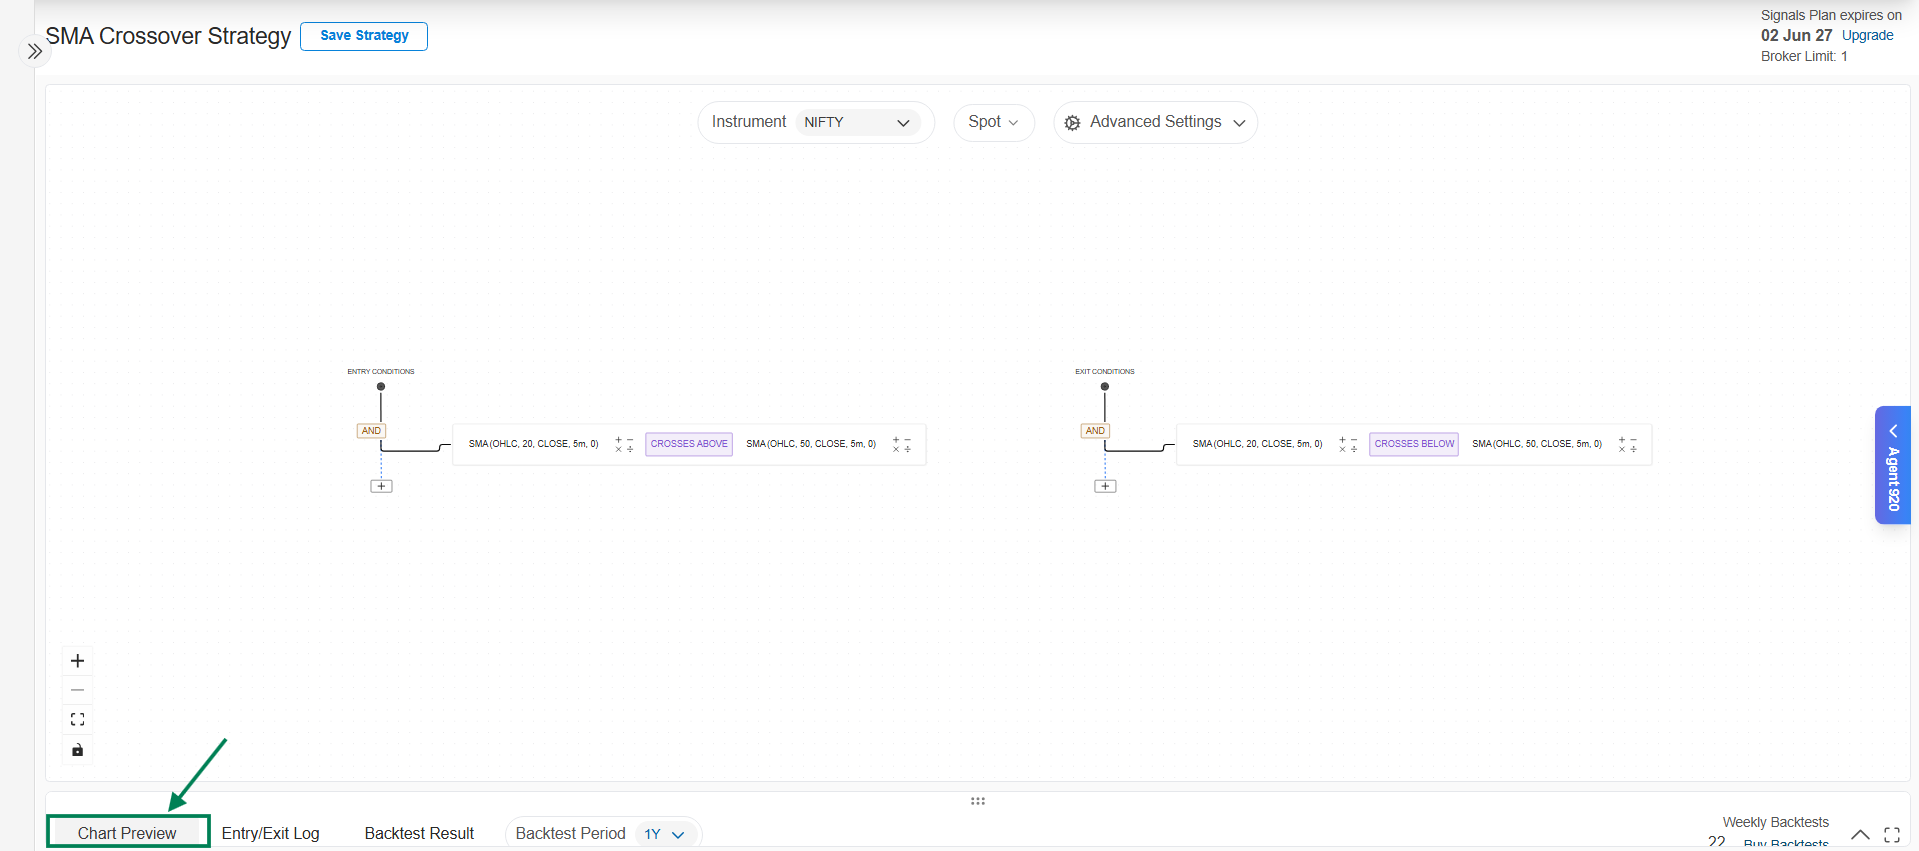
Chart Preview
The Chart Preview marks every entry and exit your strategy would have generated directly on the price chart. It's the fastest way to answer the most important question: does my logic do what I think it does?
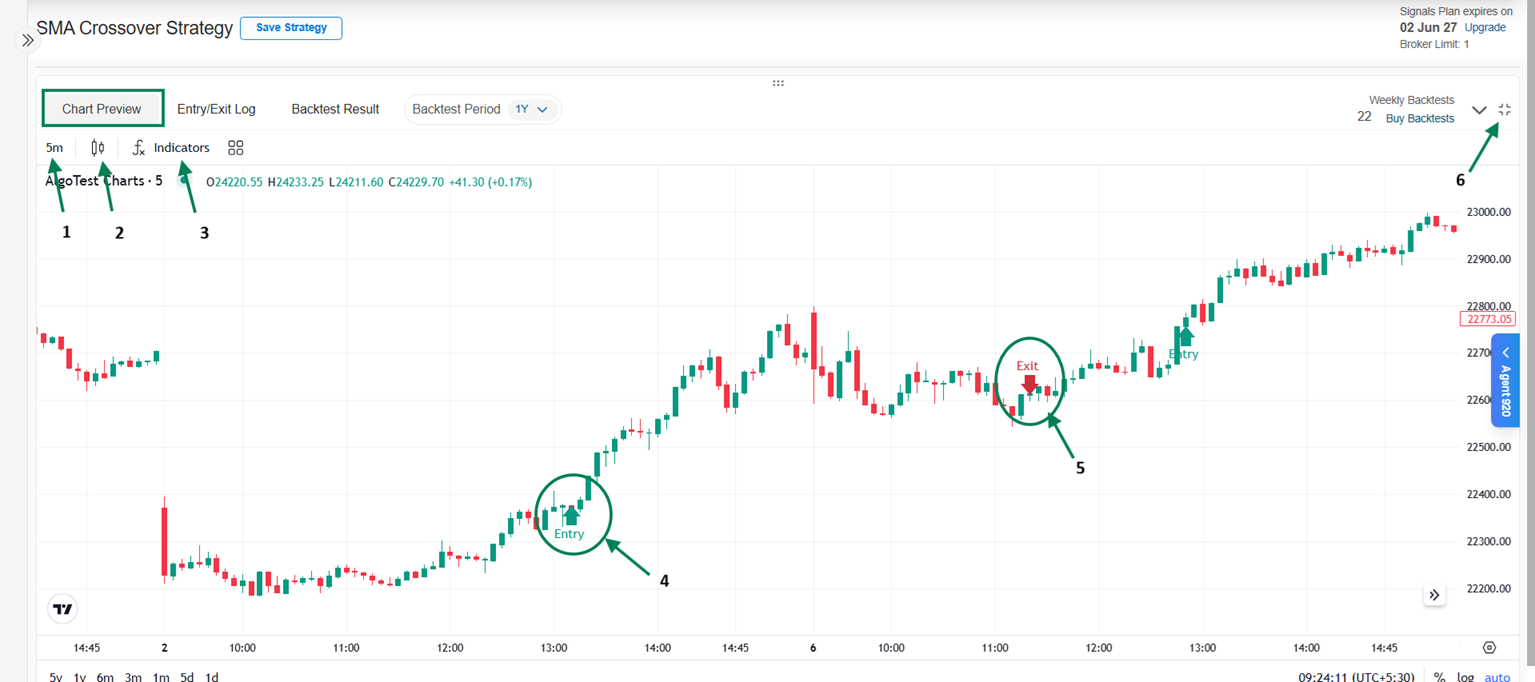
Features
- Time Frame - switch chart intervals (1m, 5m, 15m…) to inspect signals at different granularities.
- Candle Type - view as standard candlesticks, Heikin Ashi, and other formats.
- Indicators - overlay the same indicators your strategy uses (EMA, RSI, MACD…) to visually confirm each signal against the indicator values.
- Entry Signals - markers at every point the entry conditions fired.
- Exit Signals - markers at every exit, whether condition-based, stop loss, or target.
- Maximize / Minimize - expand the chart for detailed inspection.
How to validate a strategy visually
- Overlay your strategy's indicators on the chart (e.g., both EMAs for a crossover strategy).
- Pick 3–5 entry markers and check each one: did the condition actually hold there?
- Check the exits the same way.
- Look for missing signals too - places where you'd expect a signal that didn't appear often reveal a wrong operator (e.g., Greater Than where you meant Crosses Above).
For exact timestamps of each signal, use the Entry & Exit Logs. When the chart looks right, move on to Backtesting.