Analysing Strategies
Analysing the Strategy
AlgoTest's Strategy Builder gives you the flexibility to analyze your strategy in such a way that a trader can create an advanced strategy easily as per his risk profile.
Analyzing Payoff Graphs
AlgoTest Strategy Builder display a payoff graph alongside your chosen options. This graph is a powerful tool that visually represents the potential profit or loss you can expect at different underlying asset prices on the expiration date.
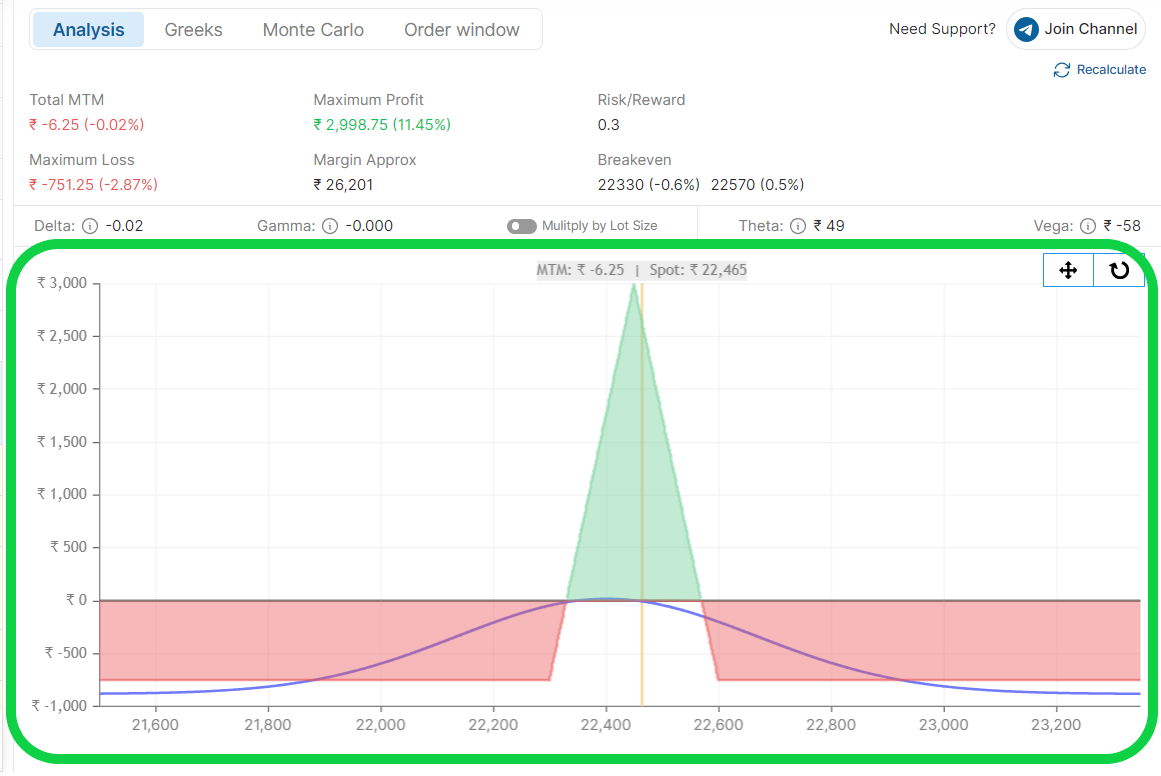
Here's how to interpret the payoff graph:
-
X-axis: Represents the price of the underlying asset on the expiration date.
-
Y-axis: Represents your potential profit or loss.
-
Line: The line on the graph depicts your strategy's current payoff at different underlying asset prices.
-
Blue Line: The line represents your potential profit and loss at different underlying prices on the expiry date.
By analyzing the payoff graph, you can assess the potential risk-reward profile of your strategy before committing to real capital. It allows you to visualize how much you could potentially gain under various market scenarios and identify your maximum potential loss.
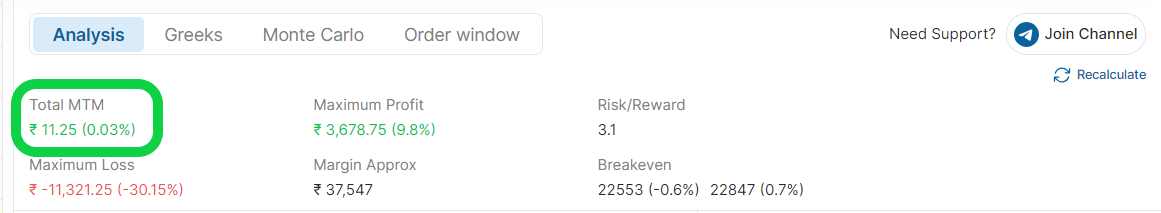
Total MTM
It shows the current total profit or loss (realized + unrealized) of your strategy.
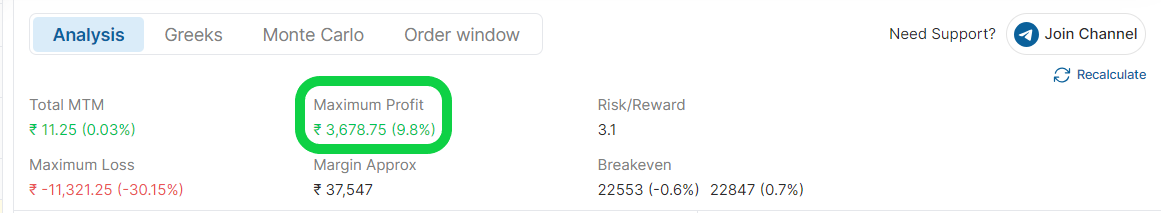
Maximum Profit
It shows you the maximum profit your strategy can achieve by expiration if the market moves in your favor. You can use this information to fine-tune your strategy based on the maximum reward you desire.
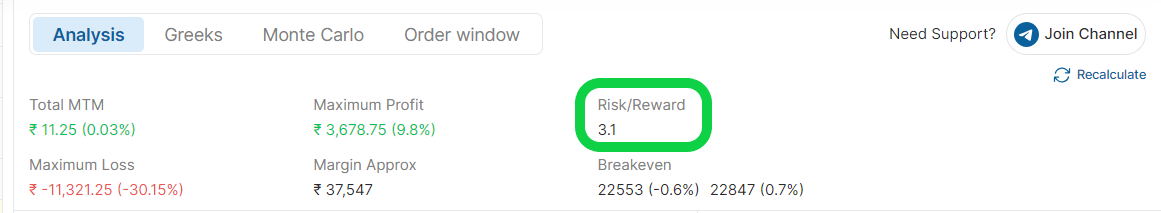
Risk/Reward
The risk-reward ratio displays the relationship between the risk and the potential reward in your strategy. It is calculated by dividing the amount of risk by the potential reward. Considering your risk profile, you can use this information to develop a strategy that offers a favorable reward for the level of risk you are comfortable taking.
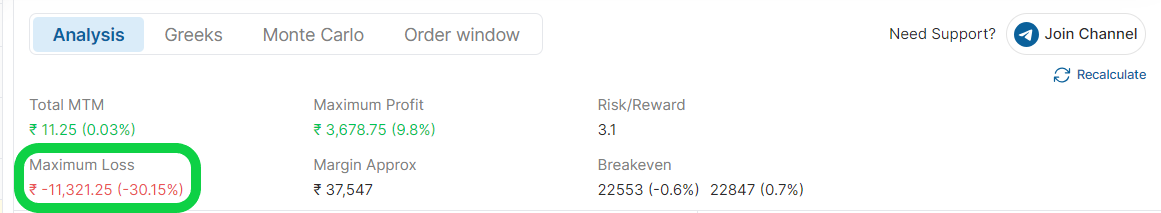
Maximum Loss
It shows the maximum potential loss your strategy may incur if the market moves against your prediction. This information can help you develop a strategy that aligns with your risk tolerance.
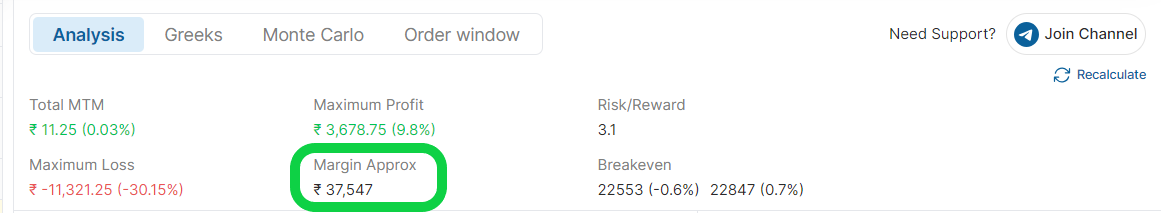
Margin Approx
It shows you approximately how much margin is required to execute this strategy with the broker. This way, you will know in advance how much margin is needed to avoid margin calls from the broker.
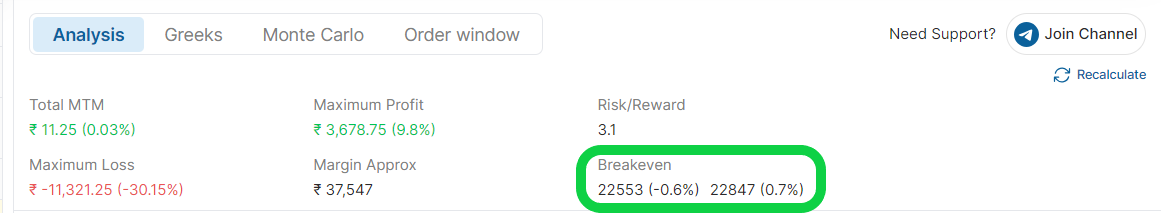
Breakeven
This indicates the price at which, if your position expires, you will break even.
For instance, in the image below, the breakeven range is between 22553 and 22847. If the underlying asset closes around 22553 or 22847, you will break even.
However, if it falls below 22553 or rises above 22847, you will start to incur losses.