Why was my stop-loss order executed even though the price wasn't hit on the chart?
Sometimes our order gets triggered on the broker's platform, but when we look at the chart, it doesn't appear to have reached that point. This situation can be puzzling, especially for new traders who heavily rely on the chart for trading. Let's explore the cause of this phenomenon and discuss effective ways to address this issue. With a better understanding and the right approach, we can navigate through these discrepancies with confidence and clarity.
Live Market Scenario
To resolve any issue, understanding the problem is crucial. I will illustrate using a live market scenario for better comprehension.
Example:- 1
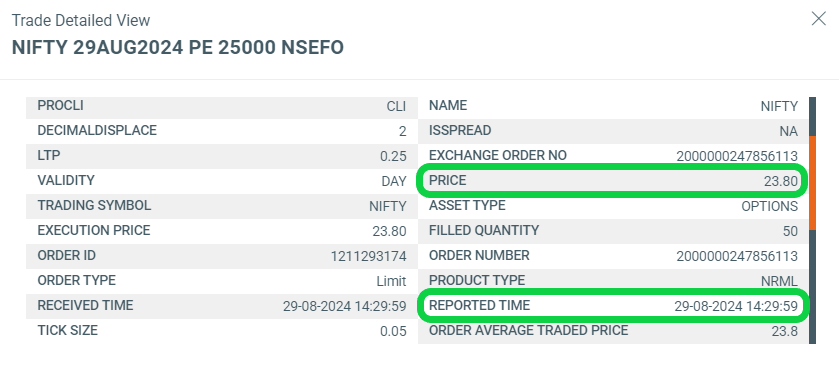
As seen in the image below, on August 29, 2024, I executed a sell order for Nifty 29 Aug 25000 PE option for 23.80 at 02:29:59.
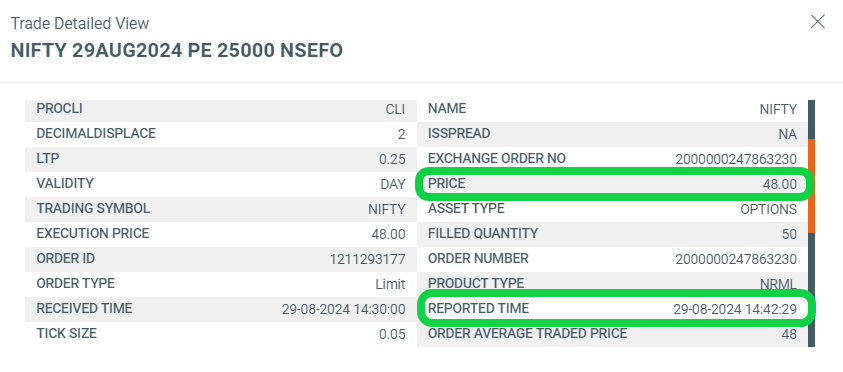
Later, I placed a stop-loss limit order to close my option sell position, and it was executed at INR 48 at 02:42:29, as shown in the image below.
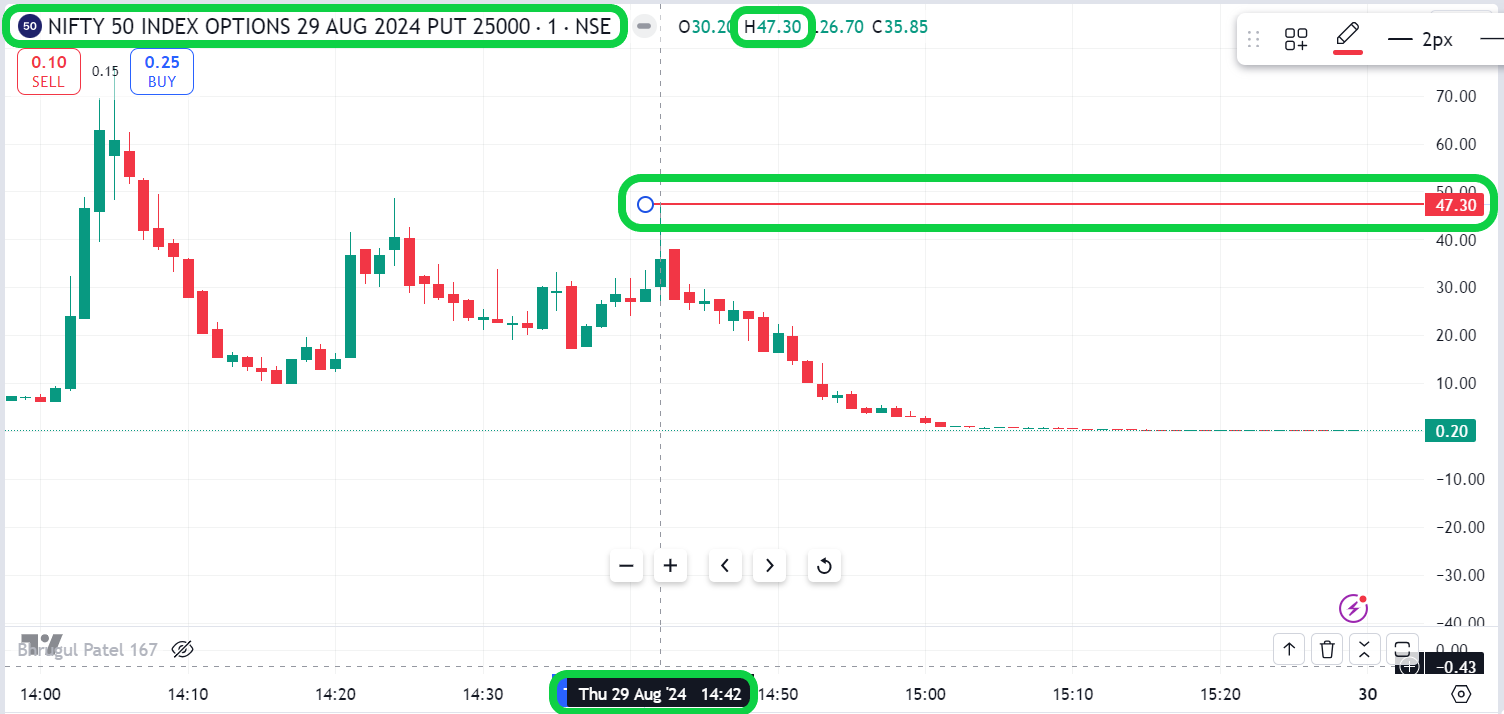
However, when I looked at the 02:42 candle price on the chart, I was shocked to find that the high of the 02:42 candle was 47.3, as shown in the image below. If the price didn't reach my stop-loss level of 48, then how did my stop-loss get activated?
Example:- 2
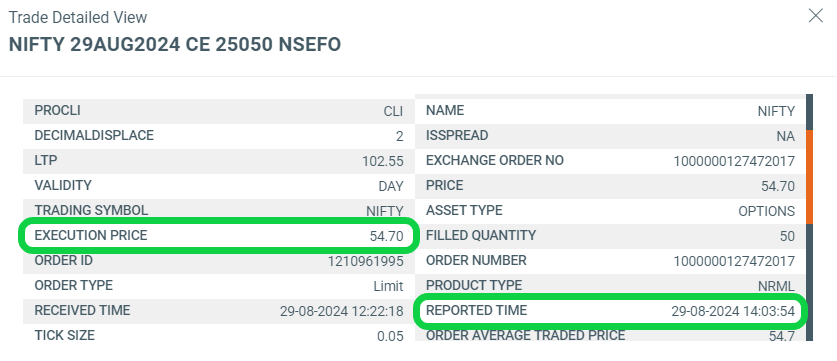
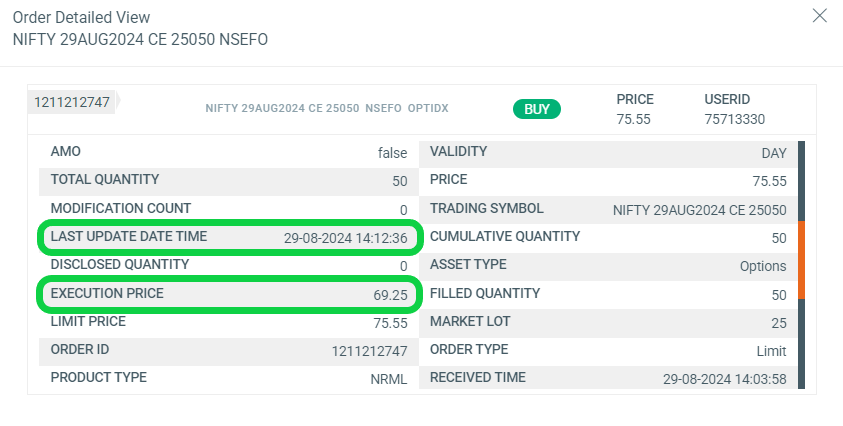
In another incident, on August 29, 2024, I executed a sell order for contract Nifty 29 Aug 25050 CE option for 54.70 at 02:03:54.
I placed a stop-loss limit order to exit my option selling position, which was executed for 69.25 at 02:12:36, as depicted in the image below.
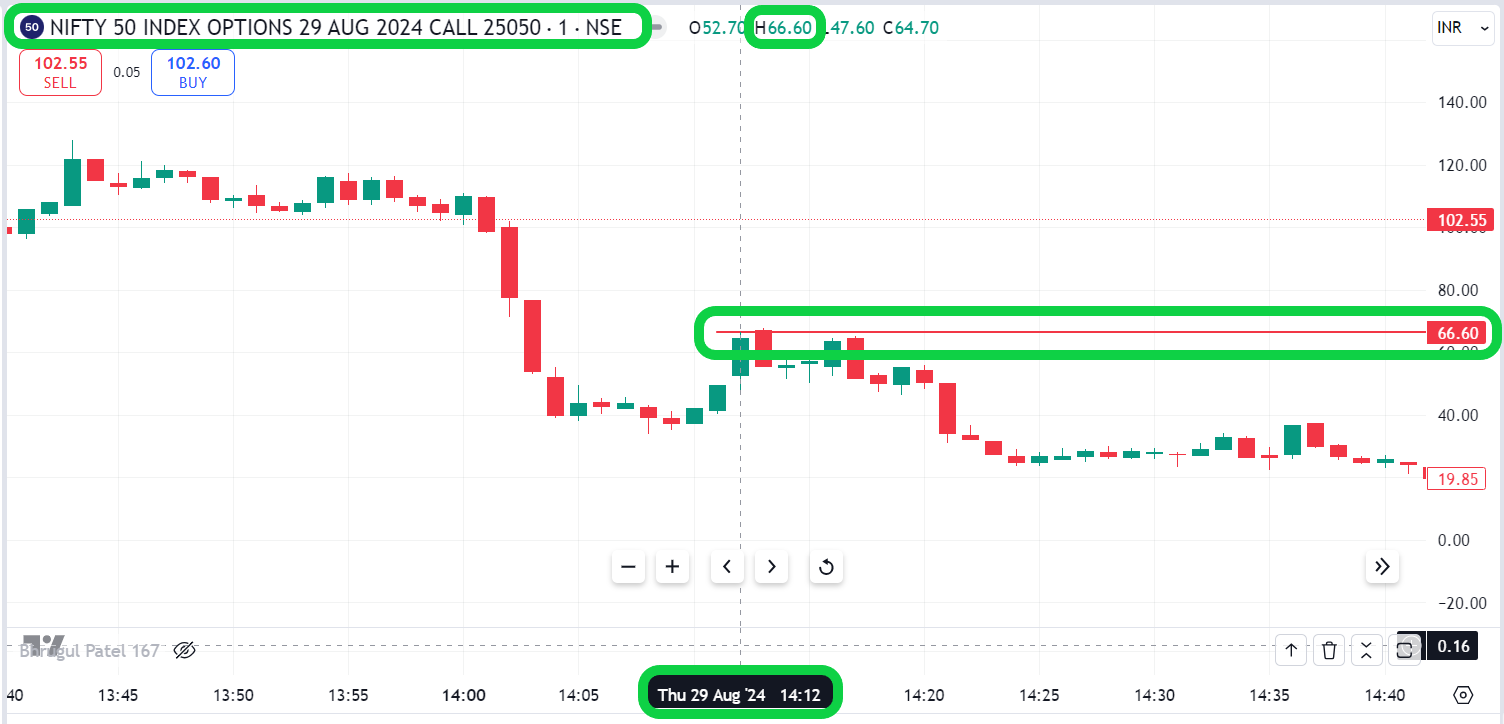
When I looked at the price of the 02:12 candle on the chart, I was shocked to see that the high of the 02:12 candle was 66.6, as shown in the image below. If the price didn't reach my stop loss at 69.25, then how did my stop loss get hit?
In the examples above, we observed situations in the live market where our stop-loss was triggered, but the price did not reflect that in the charts. As a newcomer to the market, this might appear suspicious, and we may wonder if it's some kind of scam or manipulation by an operator to trigger our stop-loss without a corresponding price movement in the charts.
However, before jumping to any conclusions, it's essential to understand how our orders get executed in the live market and how price charts are formed. Are they both based on the same data or are they different from each other? Let's delve into the next section to comprehend how order execution in the live market and price charts function.
Tick Data & Time Based Data
The main reason for this inconsistency is the difference between tick-based data used in live market order execution by exchanges and time-based data used in constructing charts. Here's a breakdown of the two:
Tick-Based Data: Your limit orders are managed by exchanges. The execution of your limit orders placed in exchanges in advance is based on tick-based data. This type of data captures every single price movement or "tick" that occurs in the market. It is highly granular and records every change, no matter how small or fleeting. So any price movement in the market can trigger your order.
Time-Based Data: Most charts, such as those showing candlesticks or bar charts, are typically constructed using time-based sampled data that is 1-second OHLC (Open, Low, High, Close) sample data provided by exchanges or their data sources. 1-second data can't capture every tick that happens in the market. The highs or lows you see on charts are made of 1-second OHLC (Open, Low, High, Close) data which sometimes doesn't capture every tick that occurred in the market.
The Logic behing this
So far, we've learned that the charts we see are mostly based on 1-second data, while our limit orders are executed based on tick-based data. Tick-based data captures every price movement, so if a price in the market hits our stop loss, it will be triggered and executed in the live market. However, when we look at charts to check highs or lows, they are made up of 1-second data, which may not capture all the price movements that occurred in the market. This means that some tick data may be missed and not shown on the chart. Therefore, your order may be executed but not displayed on the chart.
Fixing the Issue
You might think that you can do all your analysis on a broker chart, but your order can be executed at a price that is not shown on the broker chart or any third-party software chart. So, what is the solution for this?
The simple solution is to realise that there is no real issue with order execution. When you view prices on charts, you are looking at data made up of one-second samples. Most of the time, these charts will provide an accurate picture, but sometimes they may not show the highest or lowest price, and they can miss some ticks. Therefore, it's better to consider charts as a way to analyse the market, rather than relying on them to show the exact high or low every time, as charts are not accurate enough to capture every tick. It's better to verify your order book to check the price, as an order will only be executed by exchanges if there is a price at which a buyer or seller is willing to trade. Without a price, there can be no trade.