Correlation Matrix
What is a correlation matrix?
A correlation matrix shows the historical correlation coefficients between two trading strategies. This helps traders understand how different strategies are related. Understanding these relationships is important for building a diversified portfolio that reduces risk and maximizes returns by combining strategies that are not closely linked. By examining the correlation matrix, you can decide which strategies to combine and how to balance your portfolio for the best performance. Each cell in the matrix represents the correlation between two strategies, with values ranging from -1 to 1.
Here's a breakdown of what these values mean:
-
Strong Positive Correlation (Close to 1): Indicates that the two strategies tend to perform similarly. When one strategy makes a profit, the other is also likely to make a profit.
-
Strong Negative Correlation (Close to -1): Indicates that the two strategies tend to perform in opposite directions. When one strategy makes a profit, the other is likely to make a loss. We need to have a negative correlation between our strategies to have a smooth equity curve.
-
No Significant Correlation (Around 0): Indicates that there is no predictable relationship between the performance of the two strategies. Their movements are largely independent of each other.
How to view the correlation matrix?
To access the correlation matrix for your portfolio, please follow the simple steps given below.
- First, you should backtest a portfolio. To do this, go to the portfolio section and click on the "Run Portfolio" button, as shown in the image below.


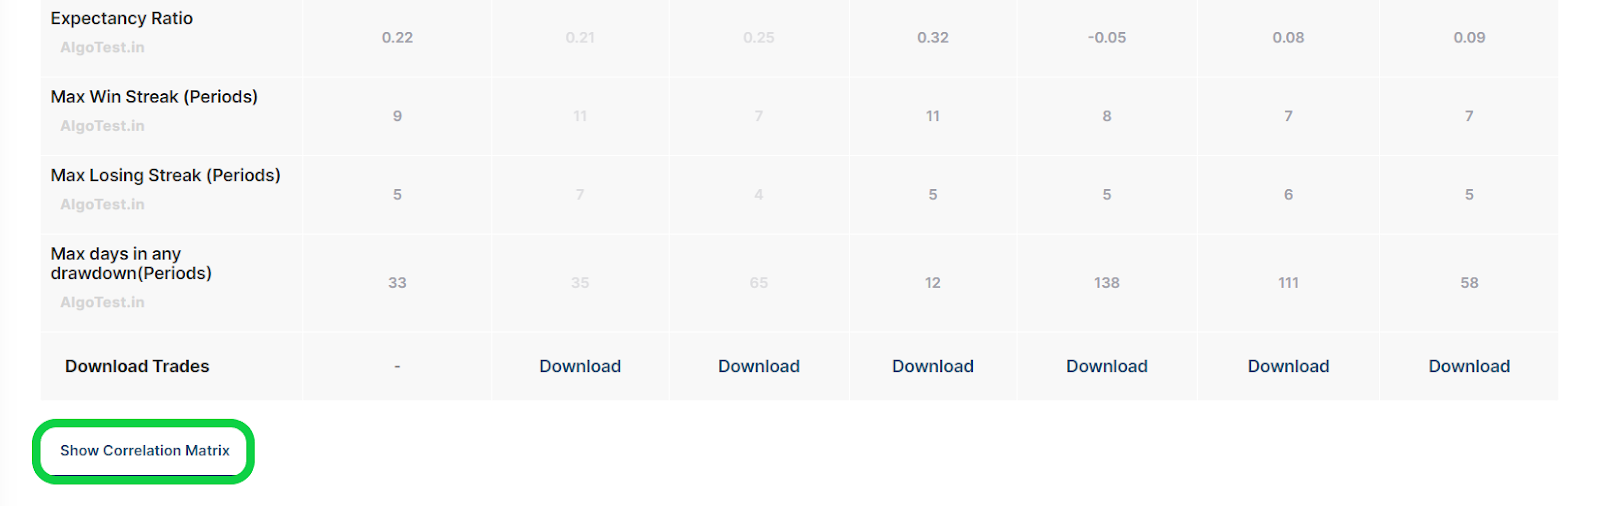
- Now, scroll down and click on the "Show Correlation Matrix" button located below the backtest report, as shown in the image below.
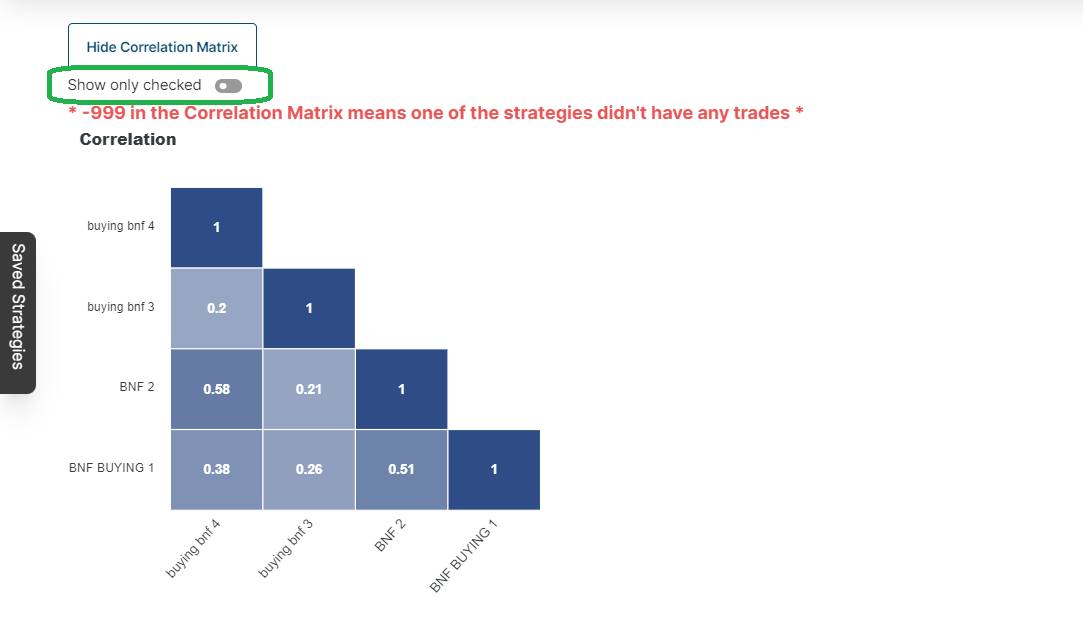
- It will display the correlation matrix as shown in the image below. You can click on the "Show only checked" button to display the correlation matrix only for the selected strategies in the portfolio.
How to Analyse a Correlation Matrix?
Understanding the correlation matrix is crucial for building a well-diversified portfolio. Using the correlation matrix, you can create a portfolio that can provide good rewards with less risk. Let's understand how the correlation matrix works.
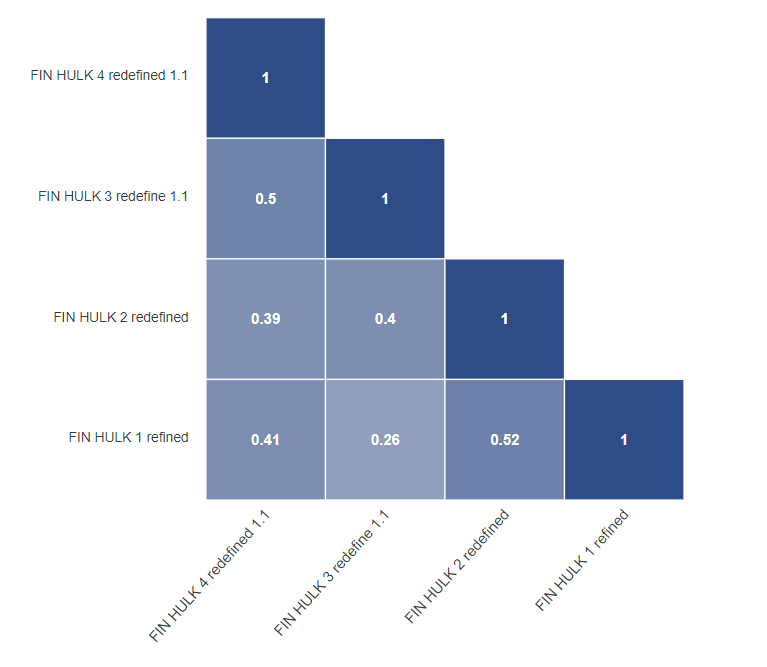
Matrix Layout
Each cell in the matrix represents the correlation coefficient between two strategies. The diagonal elements are always 1, indicating a perfect correlation of the strategy with itself.
Understanding the Values
0 to 1
As the value increases from 0 to 1, the correlation between two strategies also increases. This means that the higher the value, the more related the strategies are to each other. A high correlation value indicates that if one strategy is making a profit or a loss, the other will also likely to make a profit or a loss on the same day.
-1 to 0
As the value decreases from 0 to -1, the correlation between two strategies also decreases. This means that the strategies are highly unrelated to each other. If one strategy is making profit or loss on a day, then the other strategy will likely do the opposite, i.e. it will make a loss or profit for that day.
 \
\
0 correlation
Zero correlation means there is no relationship between the strategies. Their movements will be largely independent of each other.
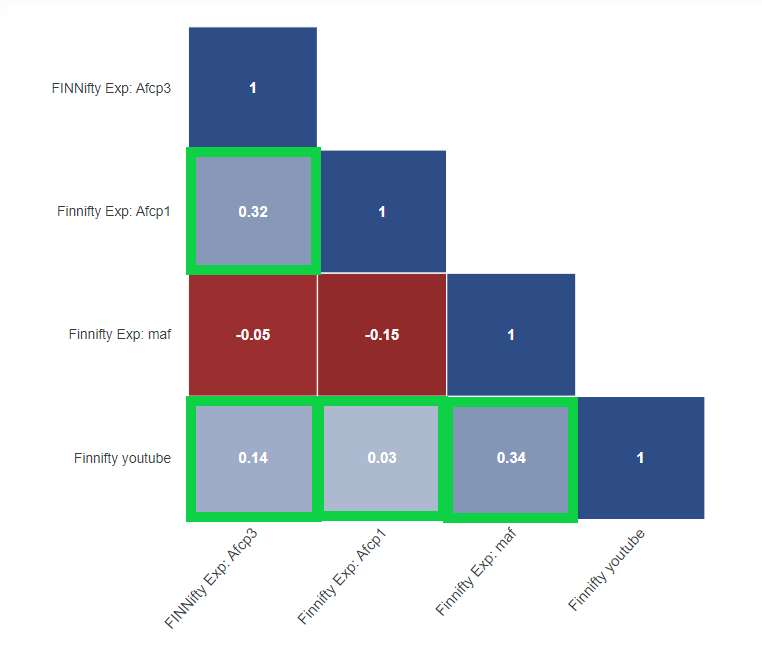
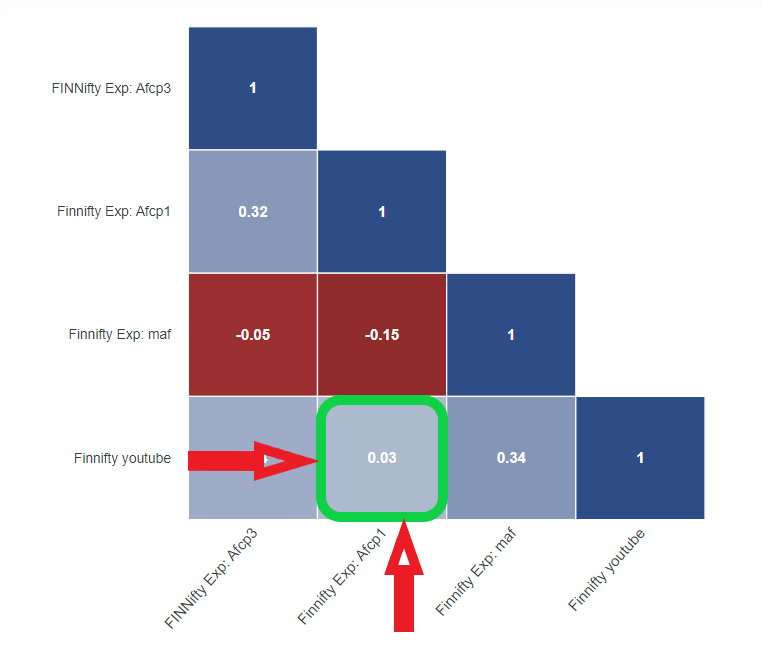
Identifying Relationships between strategies
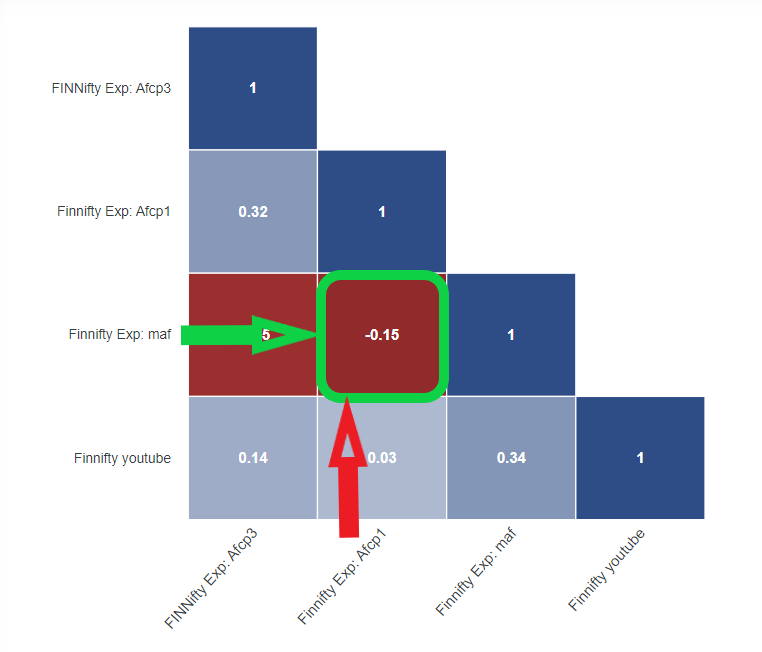
Look for strategies with lower positive correlations or negative correlations. For example, in the image below, you will see a strategy named "finnifty youtube" that has a correlation of 0.03 with a strategy named "finnifty expiry: Afcp1". This means that these two strategies are not very closely related to each other, which is beneficial for portfolio diversification.
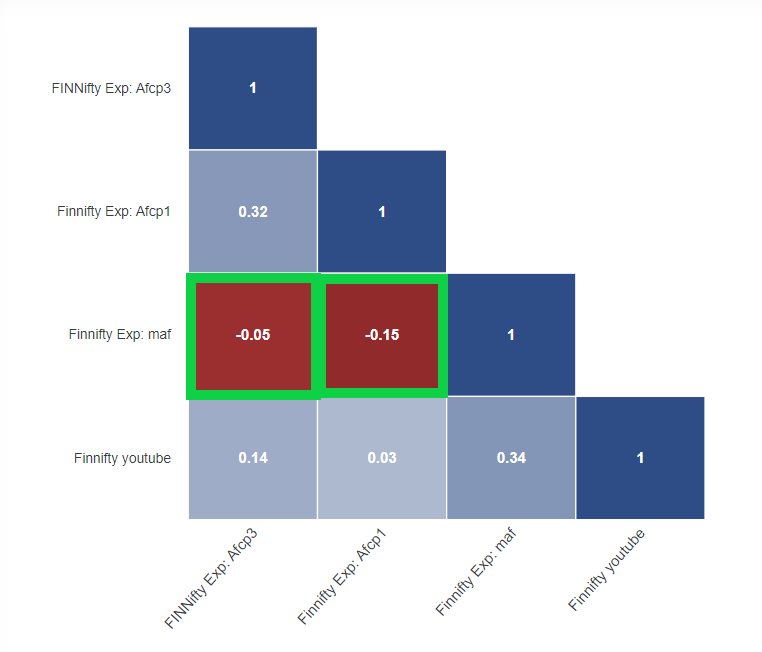
In the image below, you can observe that the strategy named "Finnifty Exp: maf" has a negative correlation of -0.15 with the strategy named "Finnifty Exp: Afcp1". Therefore, it would be a beneficial strategy to add to our portfolio for diversification.