Portfolio - Backtest Multiple Strategies Together
What do we mean by Portfolio on AlgoTest?
A portfolio is a collection of strategies. On AlgoTest, you can save strategies by inputting a strategy and clicking on "Save Strategy".

:For any queries reach out to us!
Once you've discovered some profitable strategies (click here to see an example), the next step is to combine them in a portfolio.
To build a portfolio, click on Portfolio, then "Create New Portfolio". You can select the strategies you want to include in your portfolio, and finally give your portfolio a name. On clicking "Create", your portfolio will now be ready.

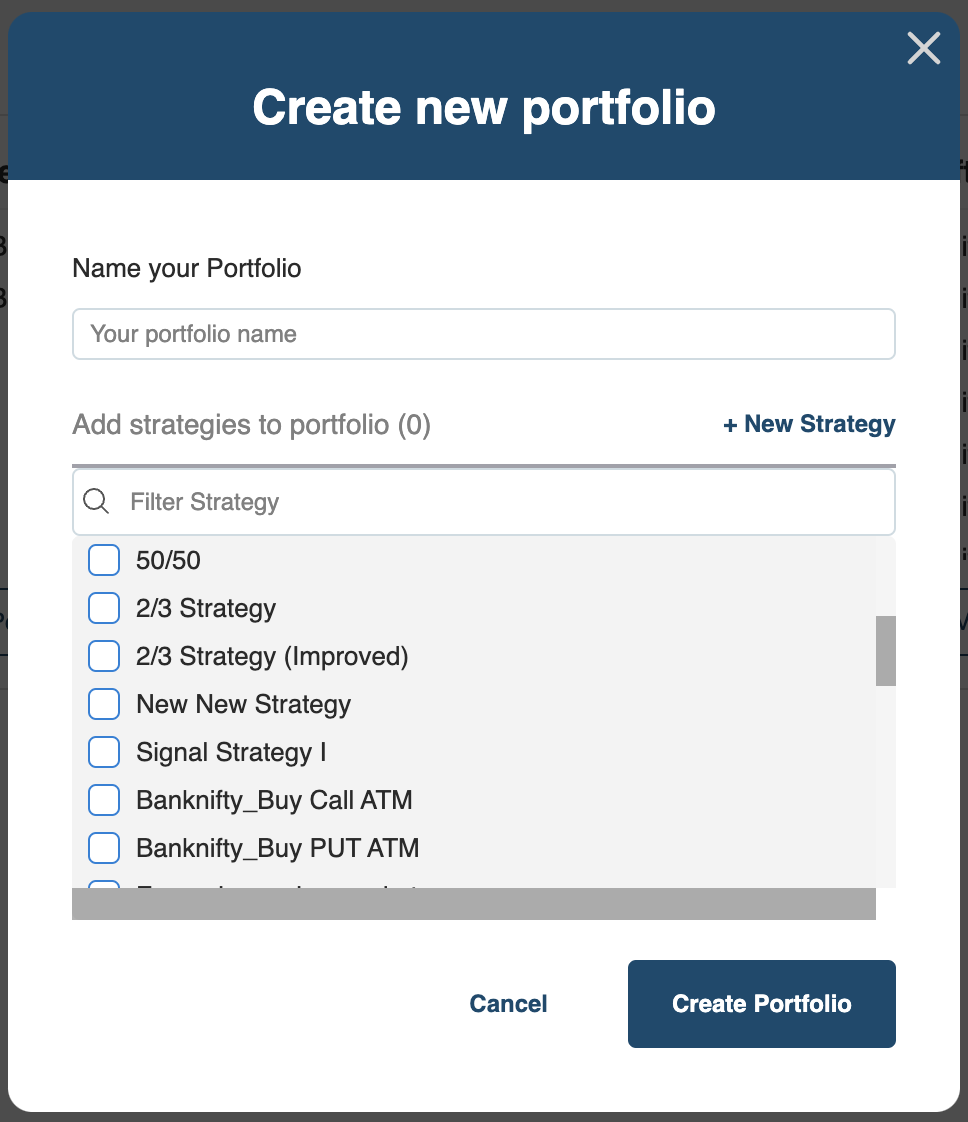
Create your portfolio
Finally, you can click on the portfolio and then run "Start Backtest". This will run a combined backtest for the entire portfolio. After this step, you will get an aggregate result, along with a correlation matrix.
Why do we do this?
The purpose of running this combined backtest in a portfolio is to harness the benefit of diversification. Running multiple uncorrelated yet profitable strategies, in theory, should lead to a smoother equity curve through reduced variance in returns. Time for an Albert Einstein quote 🙂
"In theory, theory and practice are the same. In practice, they are not."
Albert Einstein
Be Careful
Oftentimes we've seen users use this correlation estimate as proof that the strategies in their portfolio are uncorrelated or negatively correlated. This will not always be the case.
The correlation matrix represents nothing more than the historical correlation between the strategies' returns. This historical correlation estimate can change depending on which historical period (date range) you use to estimate it. In our example, if we backtest starting from Jan 2017 all the way to 11 April 2022 (5+ years), the historical correlation between the 920 straddle and the 1020 straddle is 0.2.

Five Year Correlation
On the other hand, if we just use the last year's data to backtest, the correlation value changes to 0.1.
One year correlation.
So what does this mean?
Correlations are dynamic and change with the market environment. One major implication here is that the historical profitability of your backtests could be implicitly dependent on this historical correlation. And if future correlation is different from historical correlation, you run the risk of losses.
Furthermore, correlations between strategies can change over time. So any diversification benefit you may derive from these (un)correlated strategies can disappear pretty quickly as the correlation coefficient changes!
Here is a tweet thread that highlights this point:
History
In fact, one of the greatest blowups in trading history can be attributed to precisely this breakdown of historical correlation. Here is a quote from the wikipedia article I archived sometime back:
The profits from LTCM's trading strategies were generally not correlated with each other and thus normally LTCM's highly leveraged portfolio benefited from diversification. However, the general flight to liquidity in the late summer of 1998 led to a marketwide repricing of all risk leading these positions to all move in the same direction. As the correlation of LTCM's positions increased, the diversified aspect of LTCM's portfolio vanished and large losses to its equity value occurred. Thus the primary lesson of 1998 and the collapse of LTCM for Value at Risk (VaR) users is not a liquidity one, but more fundamentally that the underlying Covariance matrix used in VaR analysis is not static but changes over time.