Scenario Analysis | Strategy Builder
We are excited to announce our new feature Scenario Analysis which allows you to check various possible future scenarios of your strategies on Algotest's Strategy Builder. This feature can help you optimise your strategies in different market conditions such as any change in IV Offset, Spot, and Date(DTE).
For instance, if you believe the market is going to be trending or range bound, you can change the values of the three parameters (IV Offset, Spot, DTE) to see how this will affect your strategy.
The Scenario Analysis feature alongside Monte Carlo Analysis is one of the many features AlgoTest provides to help you assess the future performance of your strategies.
How to use Scenario Analysis On the Strategy Builder
In the Scenario Analysis, There are three things on which you can change and check possible scenarios.
-
IV Offset
-
Spot
-
Date
Let's go through these parameters one by one
IV OFFSET PARAMETER
AlgoTest calculates the IV of your current positions. You can change the IV of your positions by entering the value by which you want to change the IV. Or you can use the + and - arrows to do so.
For example, if the IV is 15 for your current position and you want to see what happens when you offset the IV by 1. Click ‘+’ once. Now you will see how your POP, PnL, and other metrics will look like if the IV moves from 15 to 16.
The same applies if you want to see what happens when the IV is offset negatively.
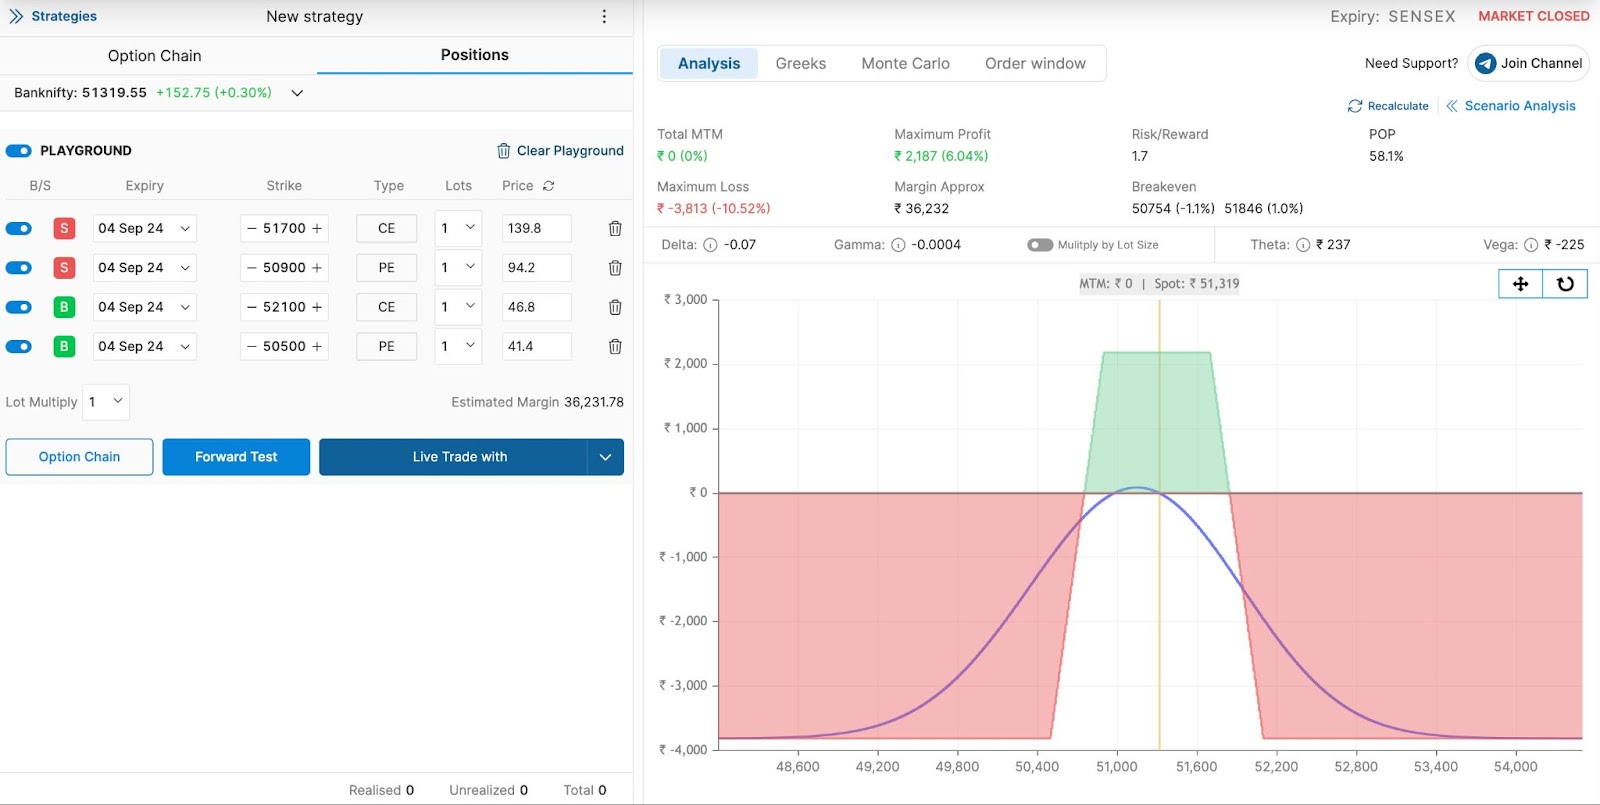
- First go to the Strategy Builder page and create a position of which you want to check the scenarios. For example we have created an Iron Condor with a defined risk and reward. a position of which you want to check the scenarios.
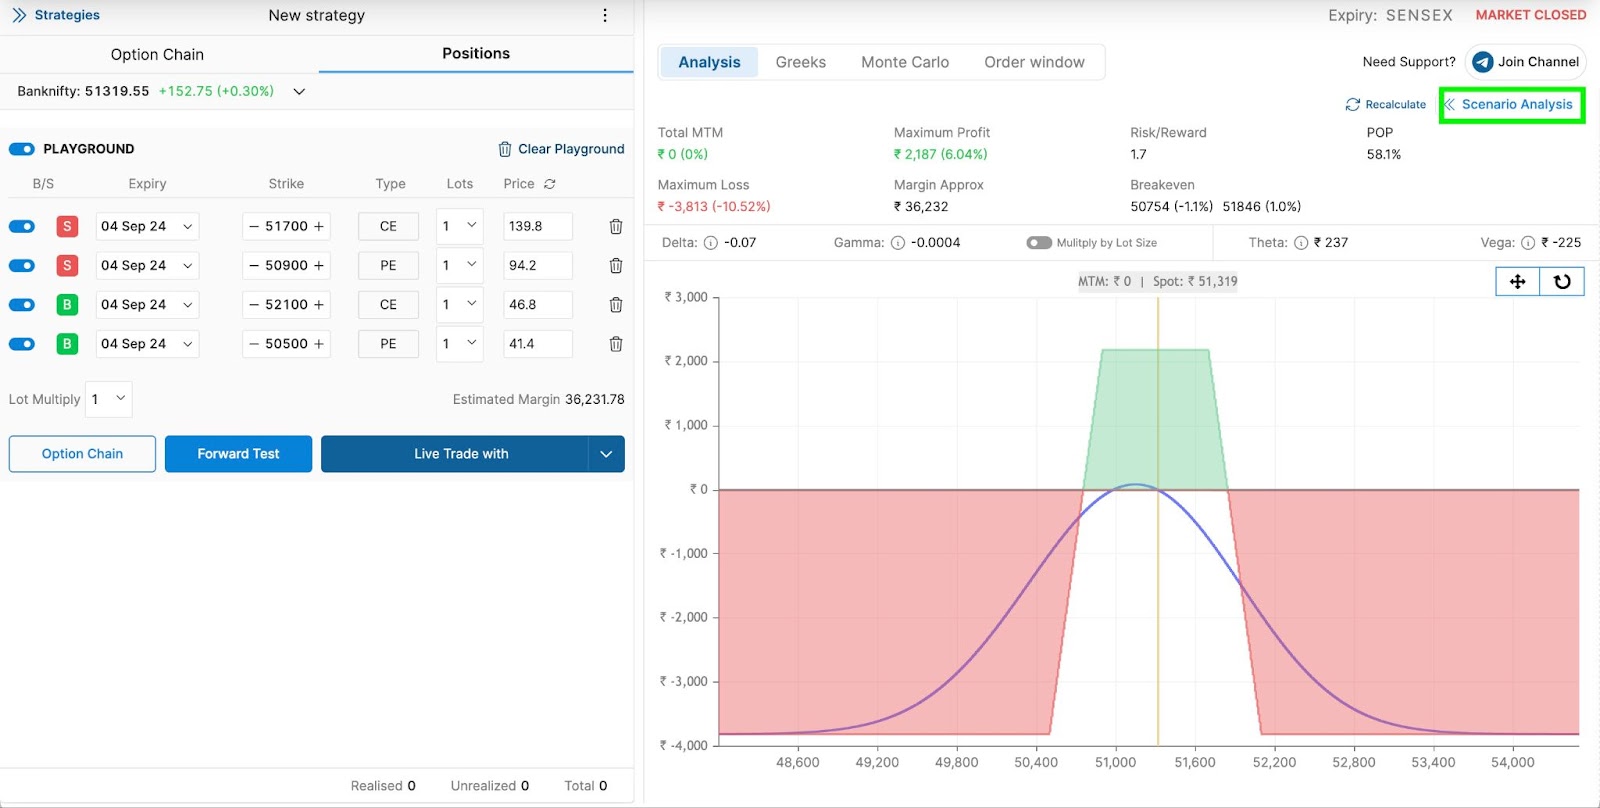
- Click on the Scenario Analysis on the strategy builder page.
- After clicking on the Scenario Analysis button it will show you a side panel like this.
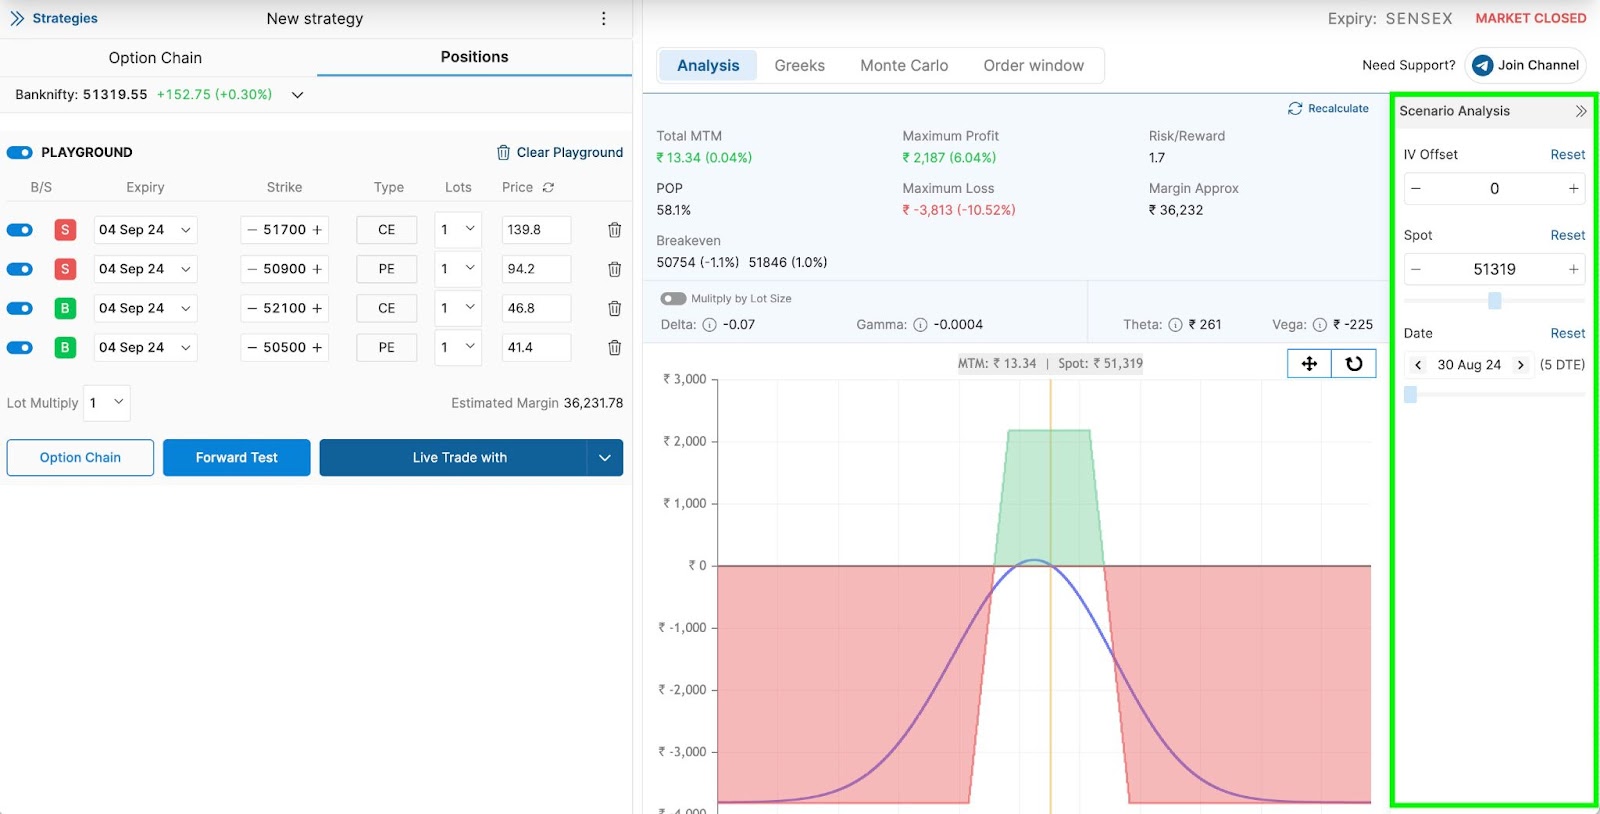
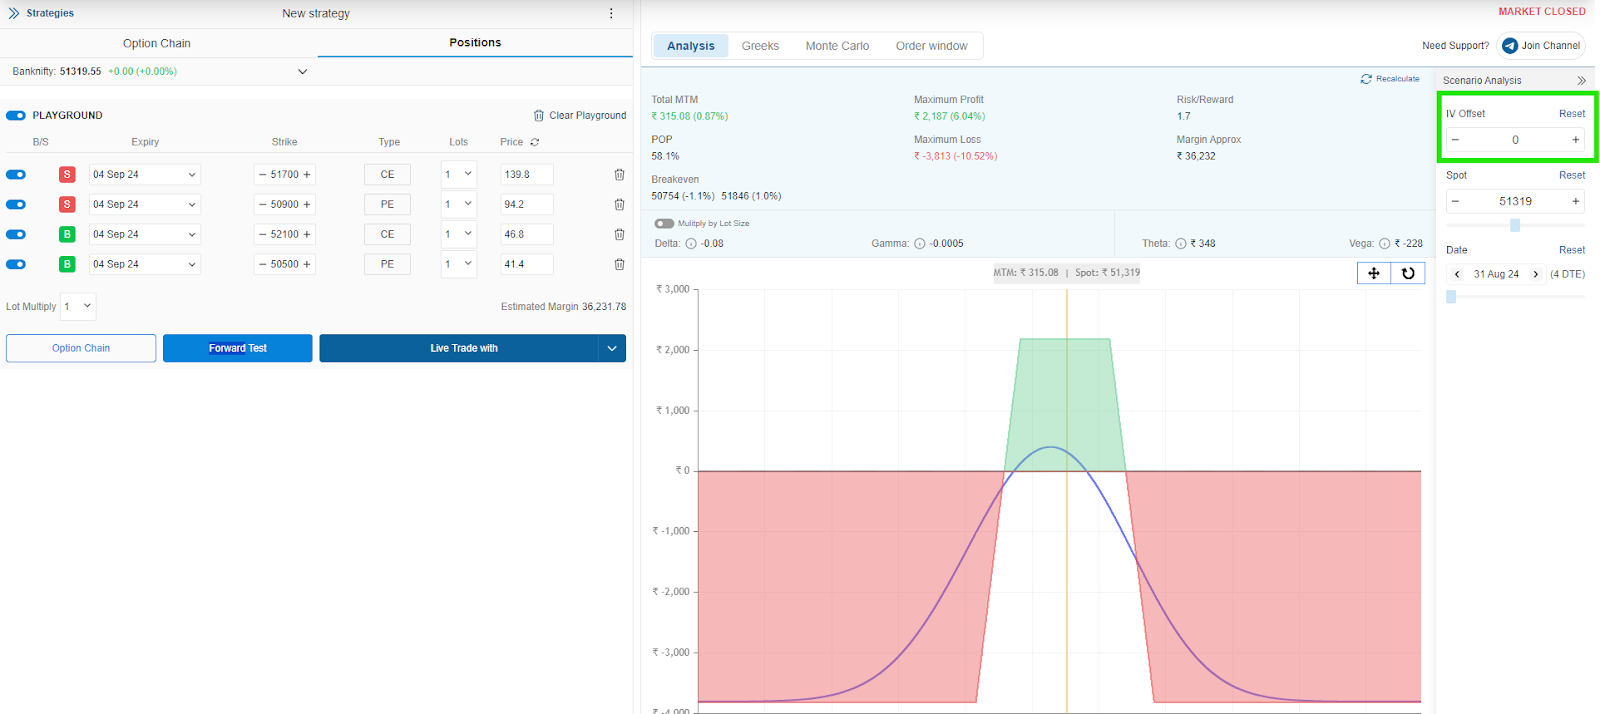
- In the Scenario Analysis side panel, you can see an IV offset button on the top.
Let's understand with the help of an example how you can change the parameter and see the affected results.
For example, it is expected that there will be a surge in IV during Budget day or Election day. So you can check sustainability of your strategies and optimise it accordingly.
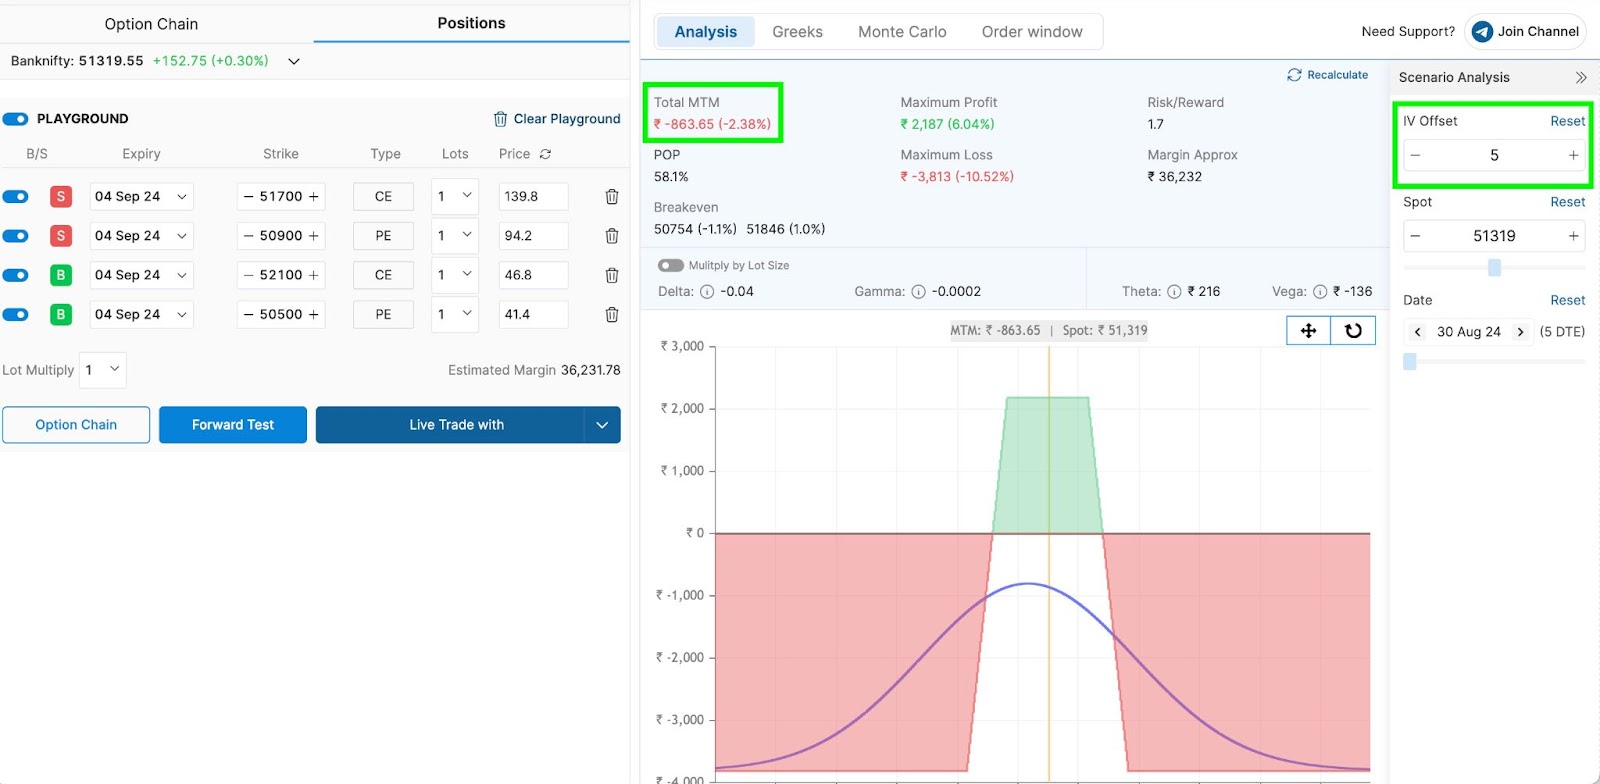
- Let's say there is an expected increase of 6-7 points in IV on an event day, So you can check the performance of your strategy by changing the value in IV offset parameter.
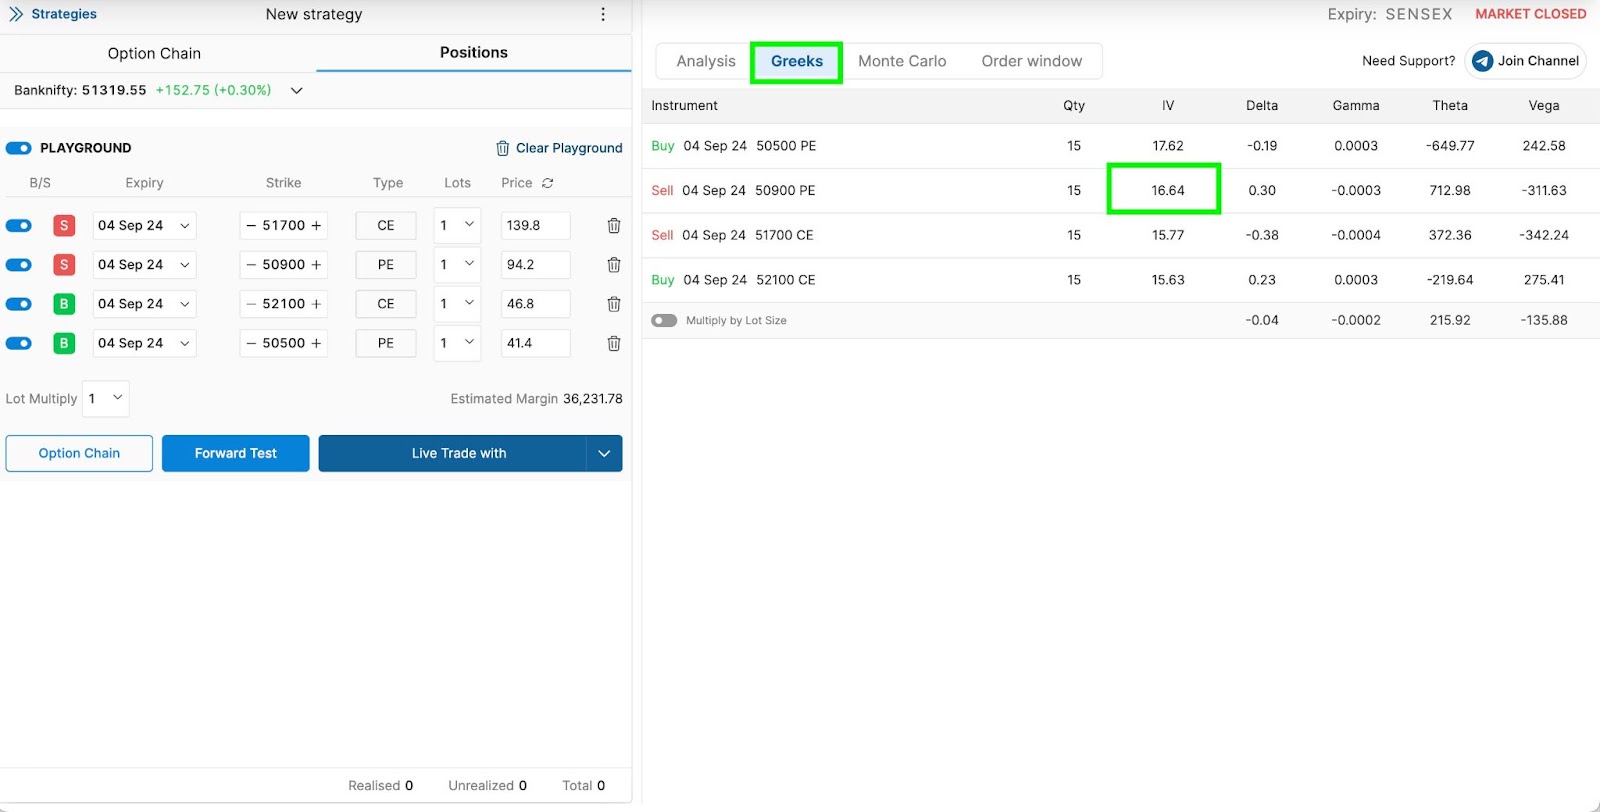
For the current example, IV for a particular strike is 11.64 and if we increase the IV by 5 points then you can see modified IV under the Greeks Section on Strategy Builder Page.
- You can also see the change in Total MTM. This shows how your Total MTM will be affected if there is an increase in IV Offset.
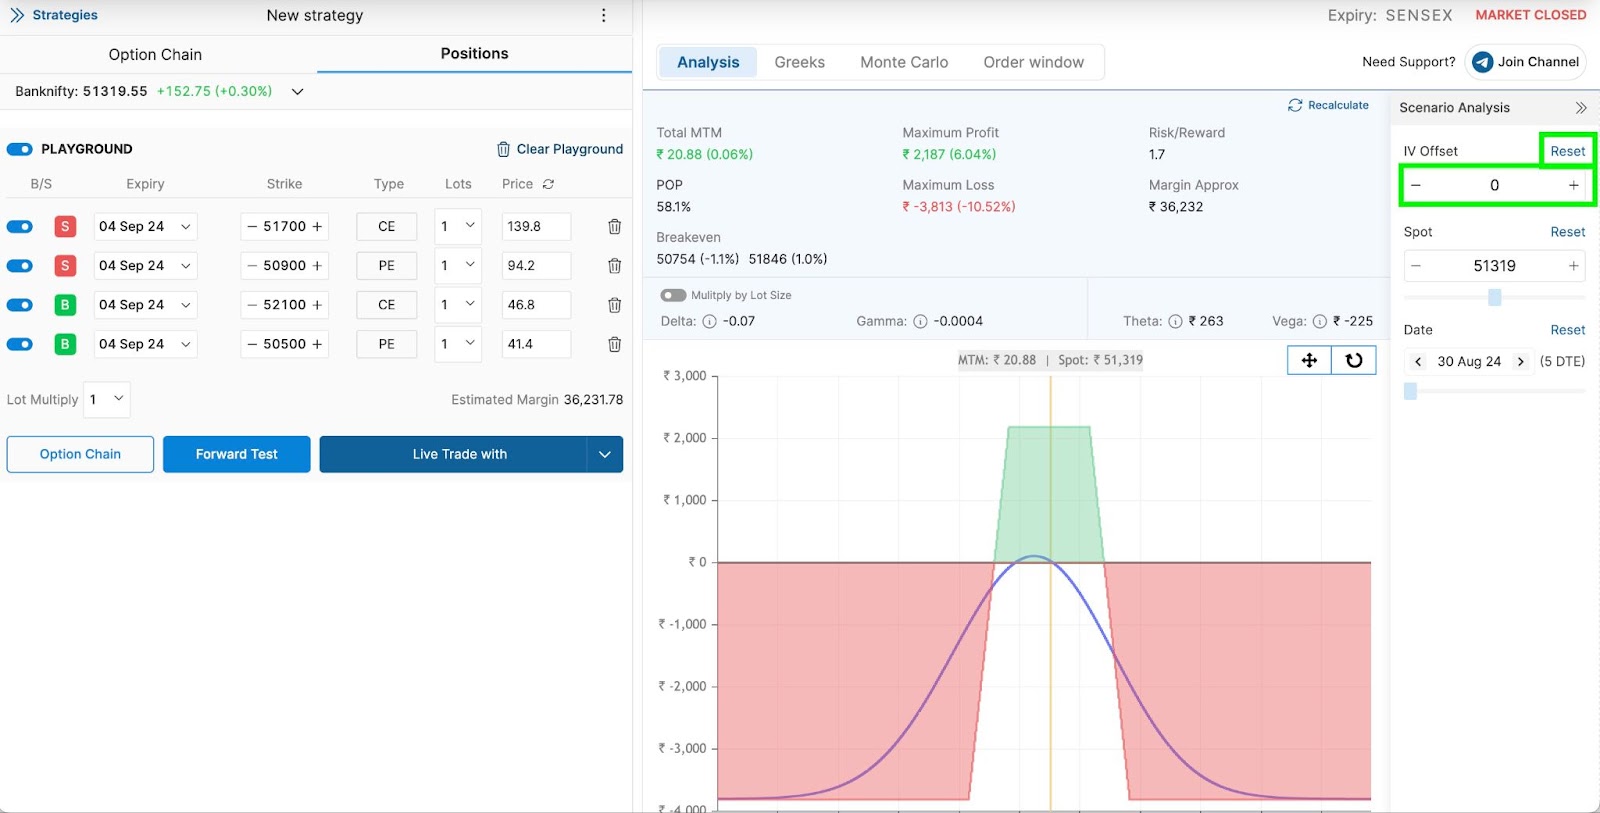
- You can always reset the parameter you changed, to see your original positions by clicking the reset button.
SPOT PARAMETER
- By using Spot in the Scenario Analysis feature you can check how your strategy will perform if the Spot price of the index increases or decreases.
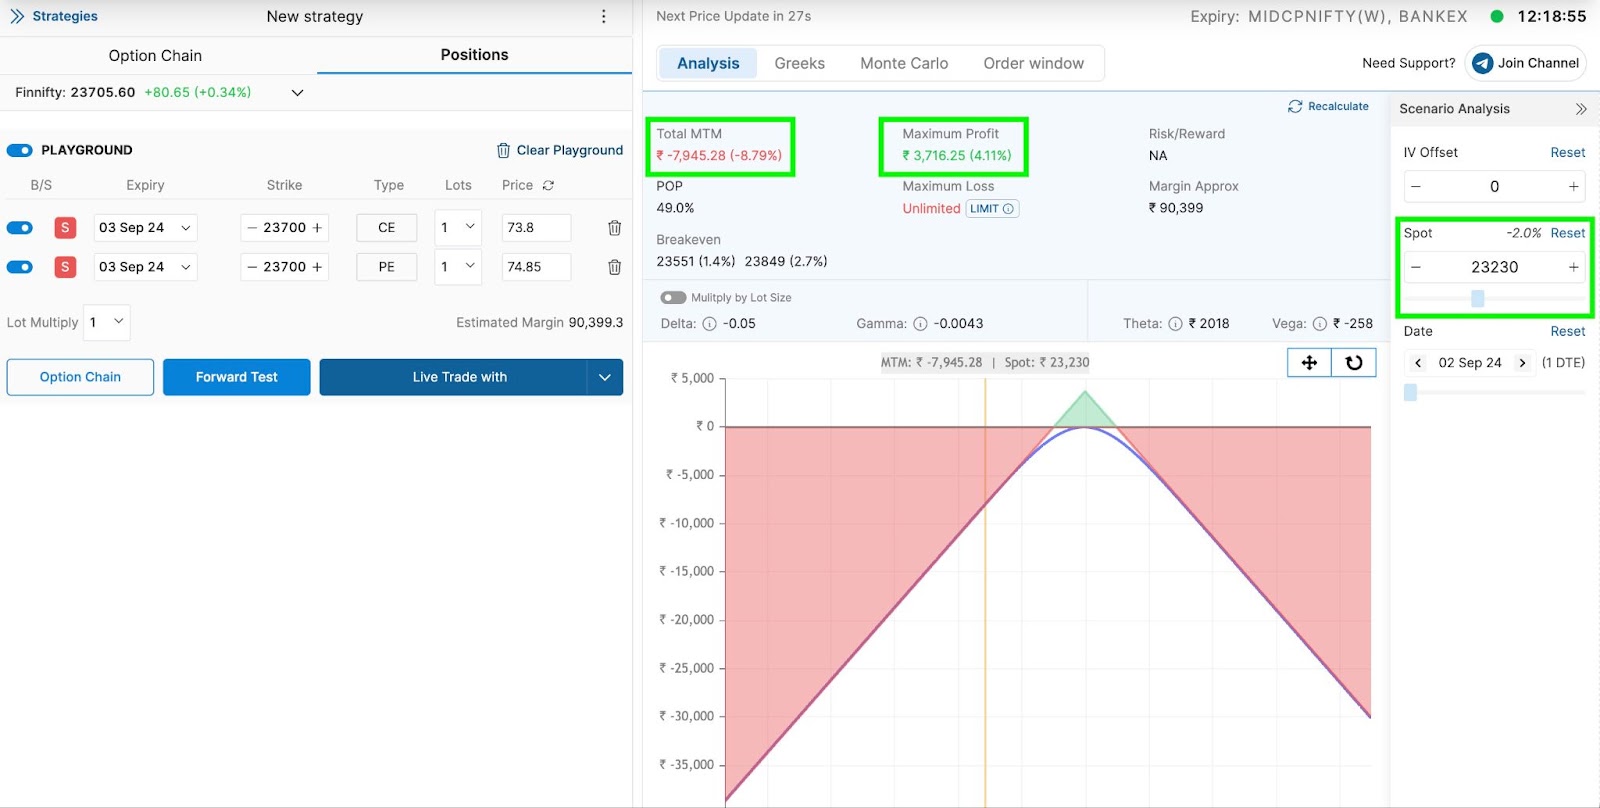
Let's say you sold a straddle when Finnnifty was trading at 23691. For using our Spot Parameter you can click on the Scenario Analysis button it will show you a side panel In the Scenario Analysis side panel, you can see the Spot Parameter in the middle of the side panel.
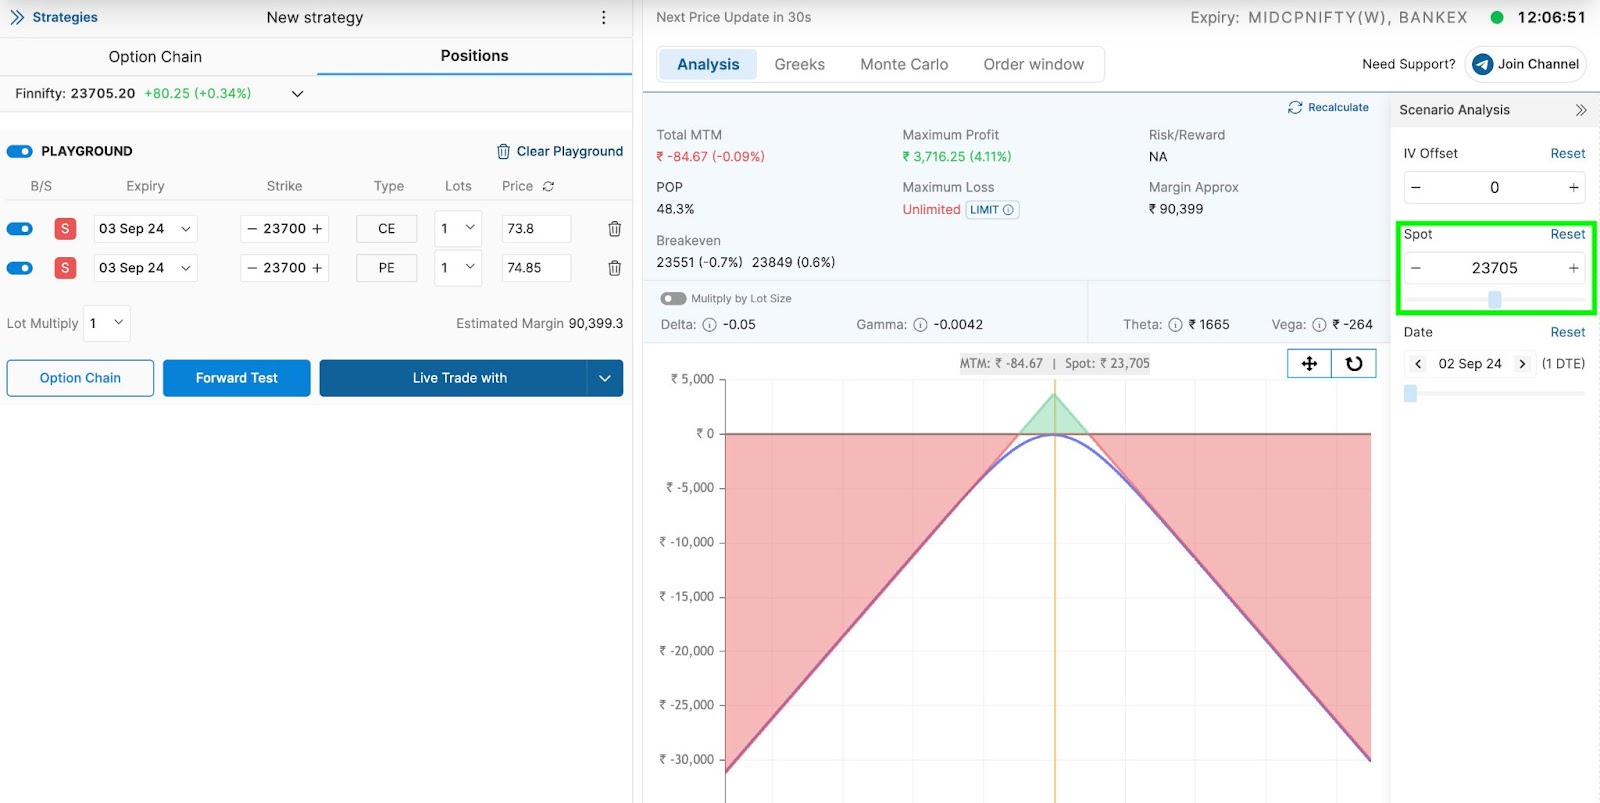
There is also a slider to move left and right if you want to change the value of the spot parameter.
Let's understand with the help of an example how you can change the Spot parameter according to your analysis and see the affected results.
For example, if you are expecting that spot price of finnifty will fall. So you can check how it will affect your positions by using our Scenario Analysis feature. Lets see how your positions will change if there is a fall of 2% from your current position and finnifty is trading at 23230.
-
You can observe the change in Total MTM, which reflects how your Total MTM would be impacted by a 2% decline in Finnifty from its current price.
-
Additionally, you can explore Scenario Analysis under various market conditions based on your analysis.
-
If needed, you can revert to your original positions by clicking the reset button to undo any changes.
Date/DTE
- You can also perform scenario analysis based on the number of days or the days till expiry. By adjusting the date, you can observe how your positions will be impacted after the specified number of days.
You can also see how your deployed strategy will perform as days till expiry reduces. To use the Date Parameter, click on the Scenario Analysis button, which will open a side panel. In the Scenario Analysis side panel, you'll find the Date Parameter located in the bottom.
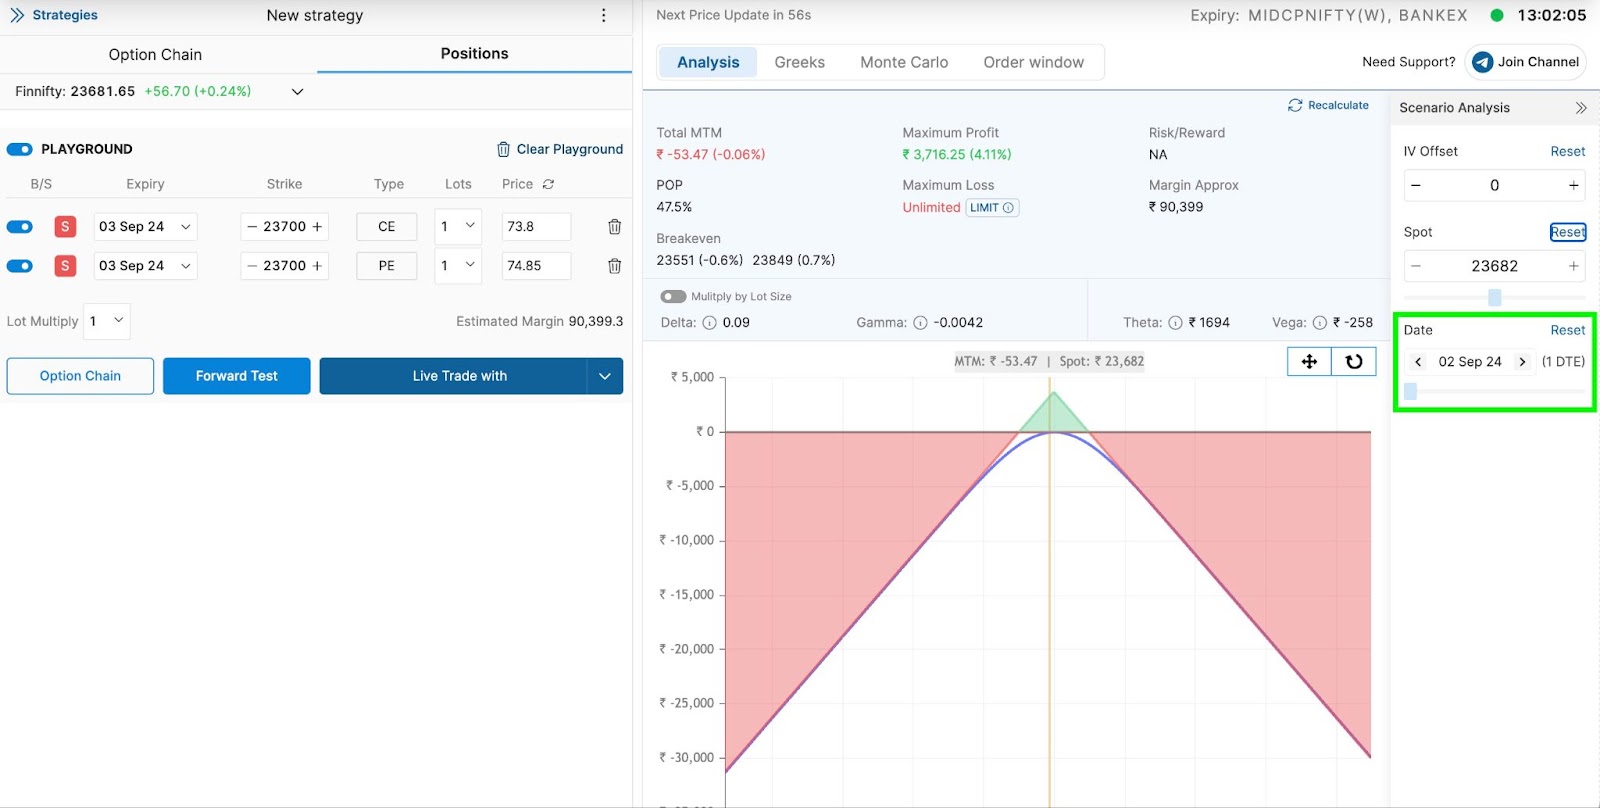
There is a slider to the right if you want to change the Date.
Let's understand with the help of an example how you can change the date according to your analysis and see the affected results.
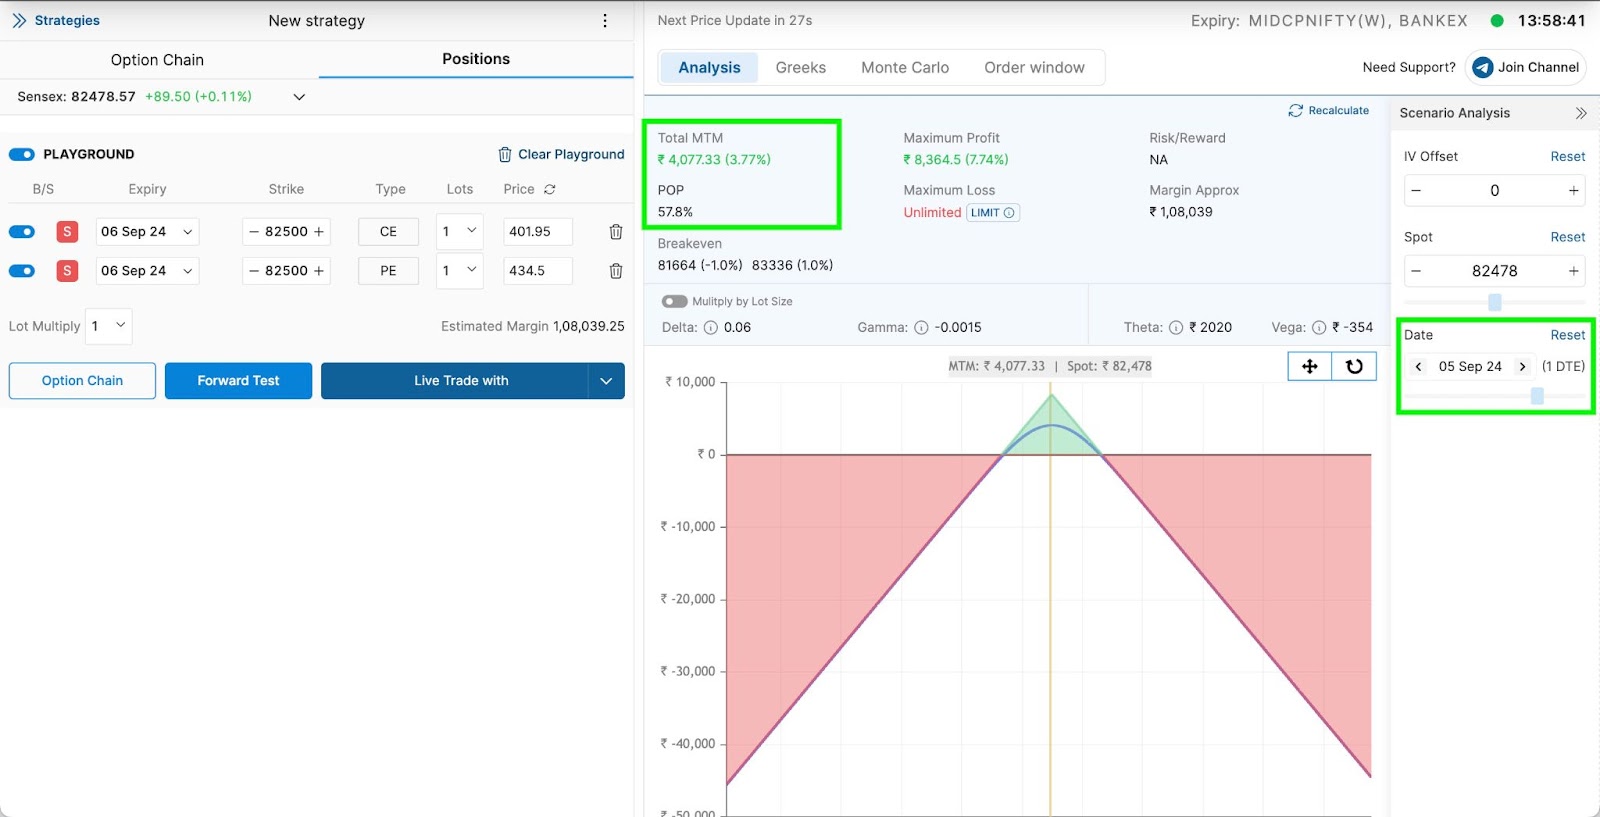
For example, if you want to do analysis based on the number of days and want to see how my strategy will perform after a particular number of days, say you made your positions on 2nd September and want to analyse the positions on 5th September. Let's see how your positions will change if you change the values three days later.
-
You can observe the change in Total MTM, which reflects how your Total MTM would be impacted after three days if the market remains around the same point.
-
If needed, you can revert to your original positions by clicking the reset button to undo any changes.
Similarly, you can explore the Scenario Analysis Feature for various market conditions.