Getting Started
Accessing the Simulator
To access the simulator feature in AlgoTest follow some simple steps as shown below.
Step 1.
Go to the Algotеst website, sign up for a free account, and log in to your account.

Step 2.
Now click on "Simulator" as shown in the image below :

Step 3. You will be able to view the dashboard of the simulator as shown in the image below.

User Interface
In this section, we will get a basic overview of what are the key features of the Simulator and how to use them.
Selecting a Time Period
Using this feature, you can access historical data of option strikes for a specific instrument in the option chain for the selected period. This data can be used to backtest or simulate your strategy. For instance, if you plan to sell an At-The-Money Call (CE) option on May 20, 2020, at 09:30, you would select that date and time here.

Historical Option Chain
It will display all the option data for the date and time that we have chosen in the date & time section. For instance, if we select May 20, 2020, and 09:20 as the time, it will show the historical prices for the given date at 09:20.

You can select the underlying, expiry, strike price, and position type, and create a strategy according to your rules by using a simple drag-and-drop visual interface. You can view a visual representation of an ATM Straddle Sell strategy as shown in the image below.

Positions
In this section, you can view and edit the positions you create in the option chain, as shown in the image below. Additionally, you can square off or delete a position.

Payoff Graph
In this section, you will be able to analyse your strategy visually. By using a payoff graph, you will be able to visualise the maximum loss or maximum profit your strategy can make. Additionally, you will be able to see how much profit or loss your strategy will make depending on the movement of the underlying.

Charts and Market Replay
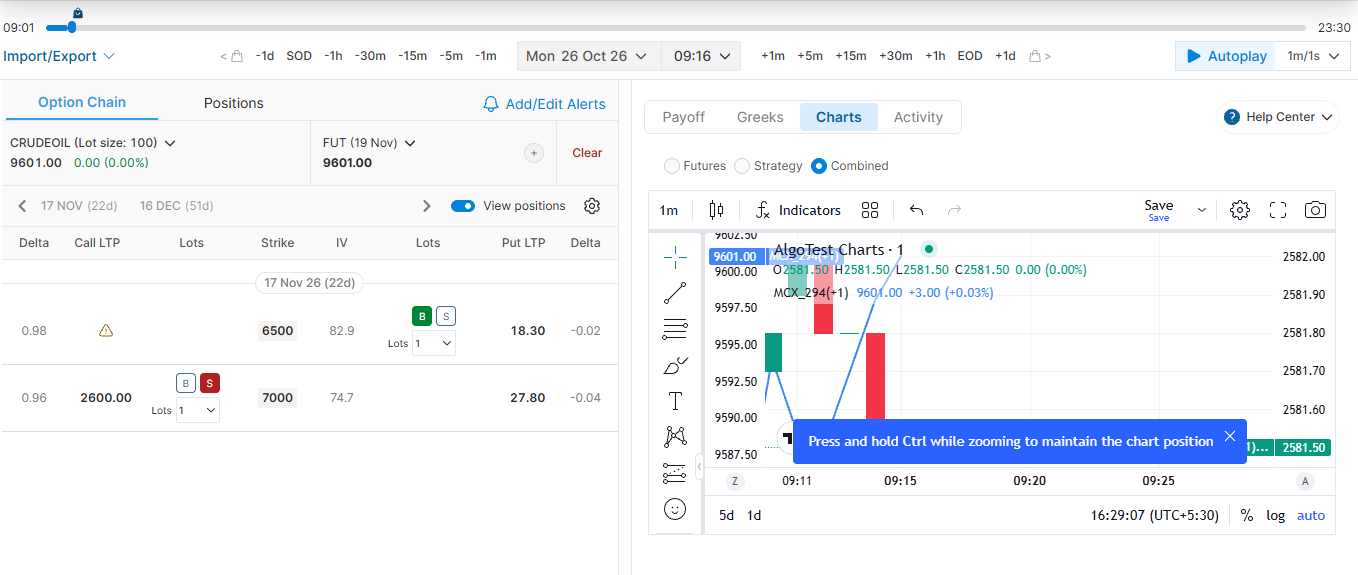
The Charts tab, next to Greeks, lets you view the underlying and your strategy during a simulation. Charts follow the date and time selected in Simulator.
Choose a Chart View
| View | What it shows |
|---|---|
| Underlying | A candlestick chart of the underlying instrument. |
| Strategy | A candlestick chart of the positions currently selected in the Positions tab. |
| Combined | The underlying as a line chart and your strategy as a candlestick chart, displayed together. |
For NSE/BSE indices, stocks with F&O, and crypto, you can view the underlying spot chart without creating a strategy. Add positions to enable the Strategy and Combined views.
For MCX, create a strategy first to access Charts. The Underlying view uses the futures chart because a spot chart is not available. Combined displays the futures line alongside your strategy candles.
Replay the Market
-
Select the date and time you want to simulate.
-
Open Charts and choose a view.
-
Click Play to advance the simulation and watch the market candles build.
-
Switch to Strategy or Combined to follow your position’s chart as the simulation progresses.
-
Move backwards to revisit an earlier point.
The chart only shows data available at the selected simulation time. For example, at 10:30 AM, it does not show data after 10:30 AM.
Moving forward reveals more data. Rewinding hides data after the newly selected time. For longer candle intervals, the candle in progress uses only the data available at that point in the simulation.
Select Positions for the Strategy Chart
-
Only positions toggled ON in the Positions tab are included.
-
Positions toggled OFF and squared-off positions are excluded.
-
The chart updates when you change the selected positions.
-
Strategy and Combined views support a maximum of six selected legs. If you select more, reduce the selection to six or fewer. Hover over the disabled Strategy option to see the limit message.
Chart Data Access
-
Free plan: Chart data is available for the current date only.
-
Paid plan: Chart data is also available for previous dates. Two days of data load initially, with additional history loading as you scroll backwards.
Initiating Simulation
In this section, you will be able to simulate the strategy across multiple time intervals. For example, you can use a feature called AutoPlay. This feature simulates your position according to the time intervals you set. For instance, if we set it to 1 minute per second, it means it will automatically simulate our strategy every 1 second, moving from 09:20 to 09:21 and then to 09:22, and so on, showing you how your strategy performs every 1 minute.

You can manually simulate your strategy by moving in 1/3/5/30-minute,1-hour or 1-day increments with each click.
