Monte Carlo Drawdown
Monte Carlo Drawdown
Have you ever thought about how to determine when a trading strategy, based on backtest results, is no longer effective? Would you be willing to keep trading the strategy until you lose all your capital, or would you consider halting trading after a certain level of drawdown, like 1x or 2x? If you decide to stop at 2x, what would prevent you from stopping at 3x or 4x?
One powerful tool to address this is AlgoTest's Monte Carlo Drawdown feature.
Monte Carlo Drawdown is an advanced methodology that randomly simulates your trades 10000 times, producing a new equity curve with each simulation.
This approach reveals the maximum drawdown you may encounter as your trades take 10000 different paths.
By analysing the Monte Carlo Drawdown, you can accurately evaluate the risk associated with your strategy and gain insight into the worst-case scenario for your drawdown. This provides a more comprehensive understanding of your strategy's performance and allows you to make informed decisions about its effectiveness.
How to Use Monte Carlo Drawdown
To use this feature follow the steps given below :-
To use this feature, start by creating and backtesting your strategy. Then, click the "Start Backtest" button to initiate the process.
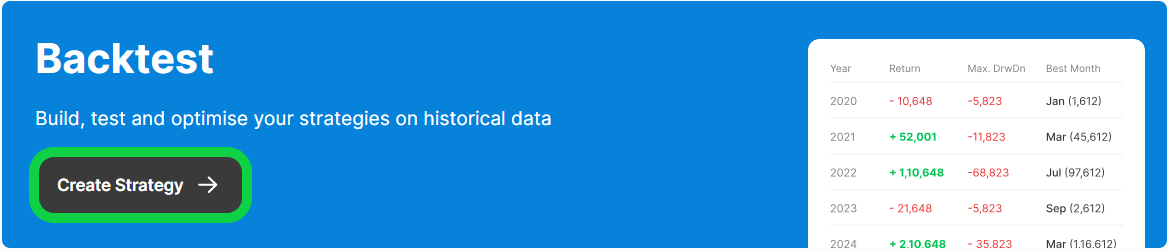

- Afterward, the backtest result for the complete period you backtested the strategy will be displayed in the image below.
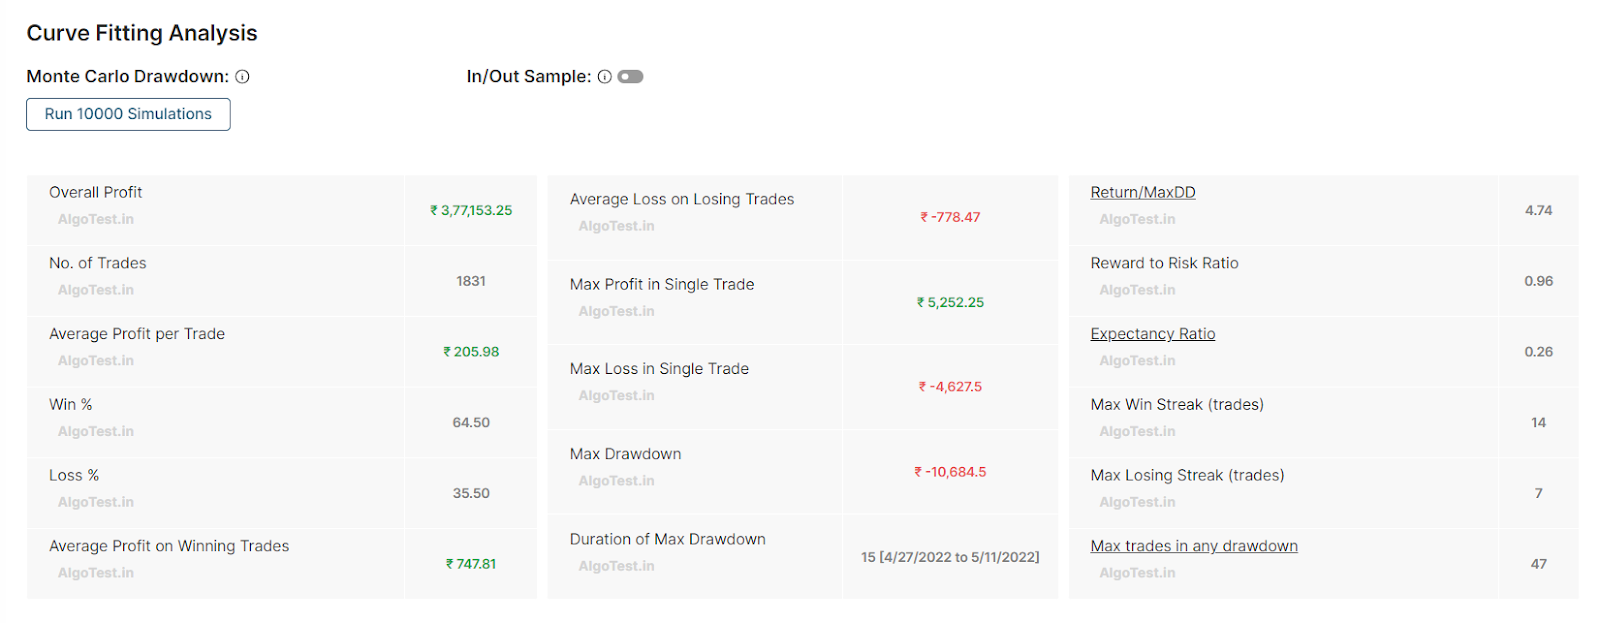
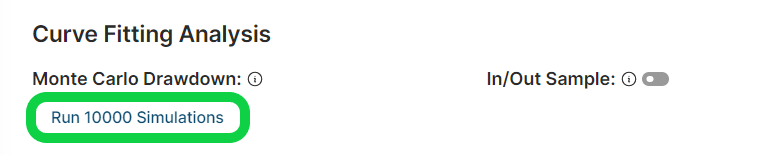
- Now, click on the "Run 10000 Simulations" button under Monte Carlo Drawdown.
- It will display an option to select a percentile. If we choose the 95th percentile, it means that 95% of the time, the drawdown was below the given value, i.e., 19332, out of all the 10000 simulations we did.
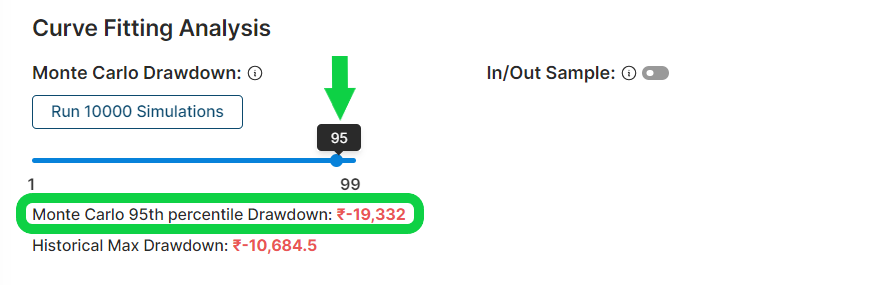
So, when you look at your historical maximum drawdown, it is 10684. However, when you run your strategy trades through 10000 simulations, your drawdown increased to 19332. This can give you an idea of how much maximum drawdown you may expect.