Setting up the Simulator
Selecting the Time Period
First, you need to select the period on which you want to simulate/backtest your strategy.
For that, you need to visit the simulator section by clicking on the simulator button as shown below
It will show you the simulator dashboard as shown in the image below :
Now you select the date and time at which you want to backtest/simulate your strategy. The time period section will look like it does in the image below.
For example, I want to sell an ATM CE option on 20 May 2020 at 09:30, So I will select 20 May 2020 here as shown in the image below.
Loading Historical Data in the Simulator
In Section 3.1, we learned how to select the time period for simulating our strategy. Once the time period is selected, historical data will be loaded, and the default option chain of the Nifty Instrument will be displayed. Next, we need to choose the underlying and expiry date of the instrument for which we want to load historical data and backtest our strategy.
Selecting Underlying
To select the underlying asset for your strategy in the option chain, click on the dropdown menu as indicated below.
You can select and set the underlying asset from the dropdown menu shown in the image below.
For example, if you want to create a strategy for Nifty, you should select Nifty here. This will allow you to view the option chain for the underlying asset Nifty and the historical last traded price (LTP) based on the selected time period.
Selecting Expiry
Now, we need to select an expiry for loading historical data and backtesting/simulating our strategy. We can select from weekly, next weekly, or upcoming available expiries here.
Depending on the selected expiry, the historical LTP for the chosen expiry will be displayed for the selected time period.
Strategy Creation in the Simulator
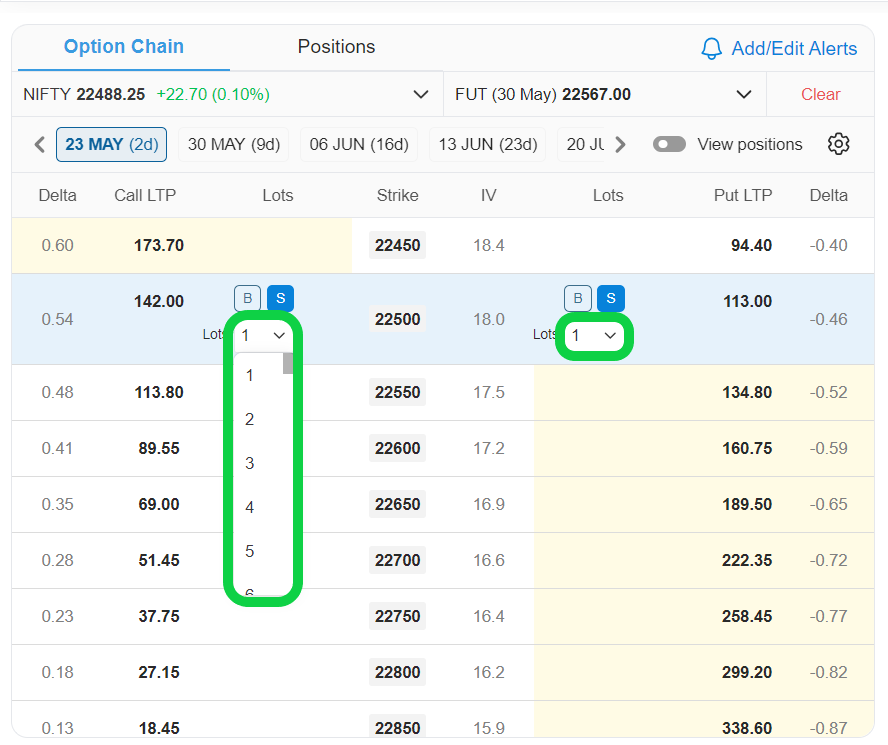
Let's dive into the exciting world of building your first options strategy. Here's a breakdown of the essential steps involved
- Selecting the Underlying Asset: Recall from the previous section, you'll first need to choose the index you want to trade option on. This selection populates the Simulator with the relevant option chain.
- Expiry Date Selection: Select the expiration date for your options contracts according to your preference.
- Picking Your Options Type: Decide whether you want to buy call options (bullish outlook) or put options (bearish outlook) based on your market expectations.
- Strike Price Selection: Choose the strike price at which you want the right to buy or sell the underlying asset. This selection significantly impacts the cost and potential returns of your strategy.
- Quantity Input: Specify the number of option contracts you want to include in your strategy. This determines your overall exposure and potential profit/loss.
By following these steps and utilising the visual representation of the option chain provided by the Simulator, you can easily construct basic options strategies, such as buying a single call option (bullish) or put option (bearish).
Creating an Iron Fly in the AlgoTest Simulator
Follow the steps below to create your first strategy:
Step 1. Go to the [Algotеst] website, sign up for a free account, and log in to your account.
Step 2. Now click on "Simulator" as shown in the image below
Step 3. You will get an interface as shown in the image below.
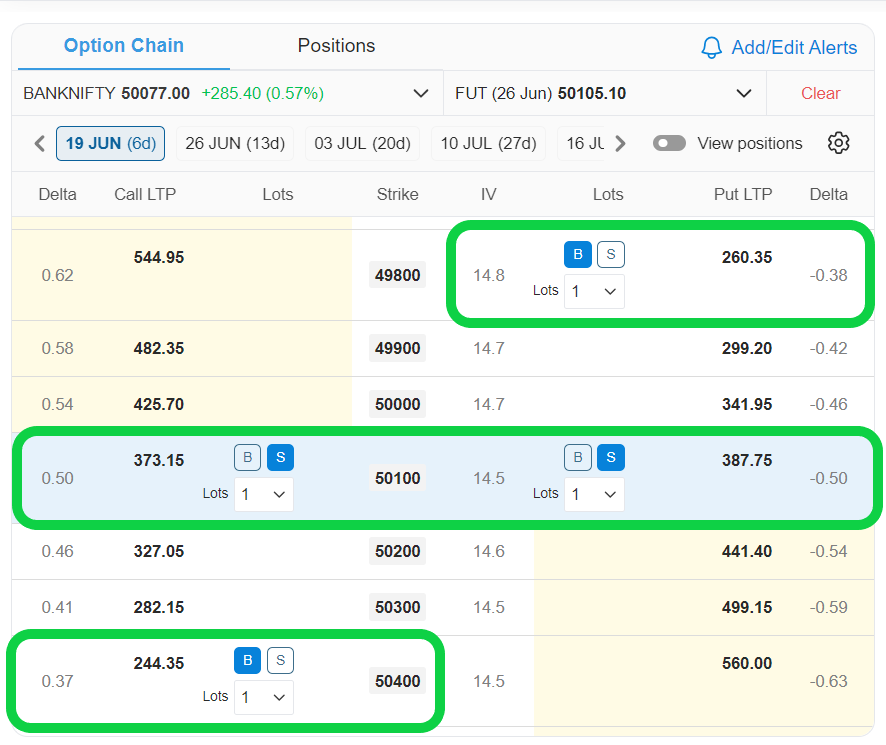
Step 4. Now add the legs from the option chain according to the strategy that you want to build. Assume if we want to build an iron fly we will sell ATM CE and ATM PE and buy OTM CE and OTM PE from the option chain as shown in the image below
Step 5. You can analyse your strategy using the different tools provided by AlgoTest.
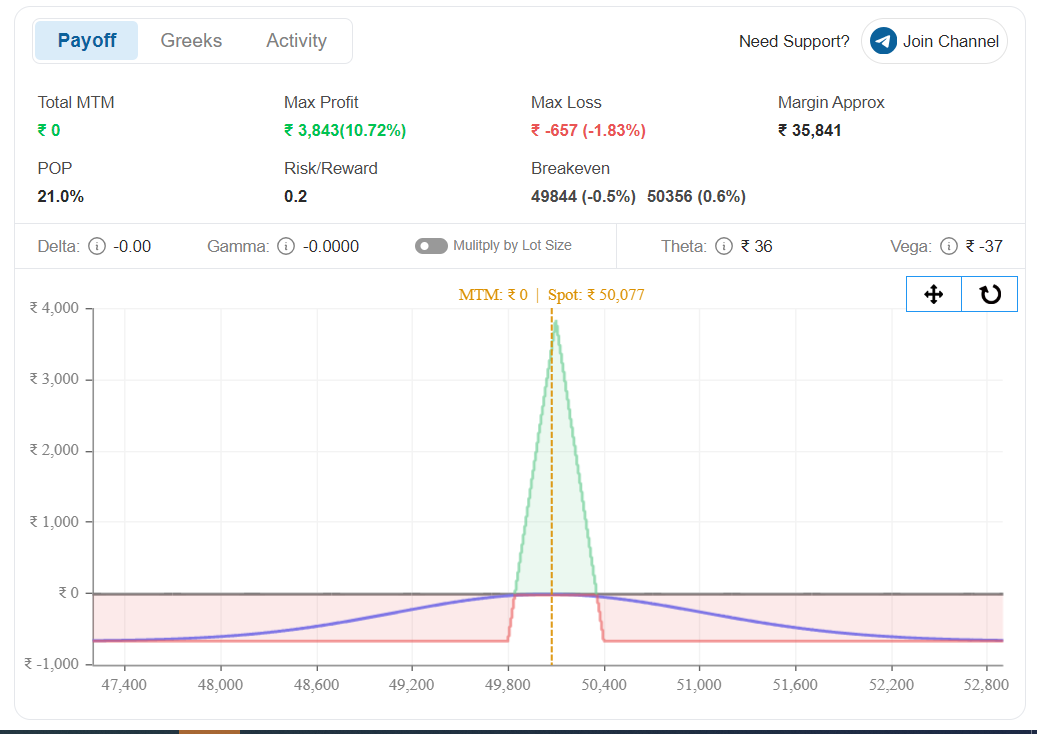
- In the Analysis section that you will find on the right side of the option chain, the Simulator provides you tools like Payoff graph, Maximum Profit, Maximum Loss, Risk Reward, Break Even Point, etc to analyse your strategy. A payoff graph is a very useful tool that helps you to determine how your position is going to end till expiry concerning the underlying move.
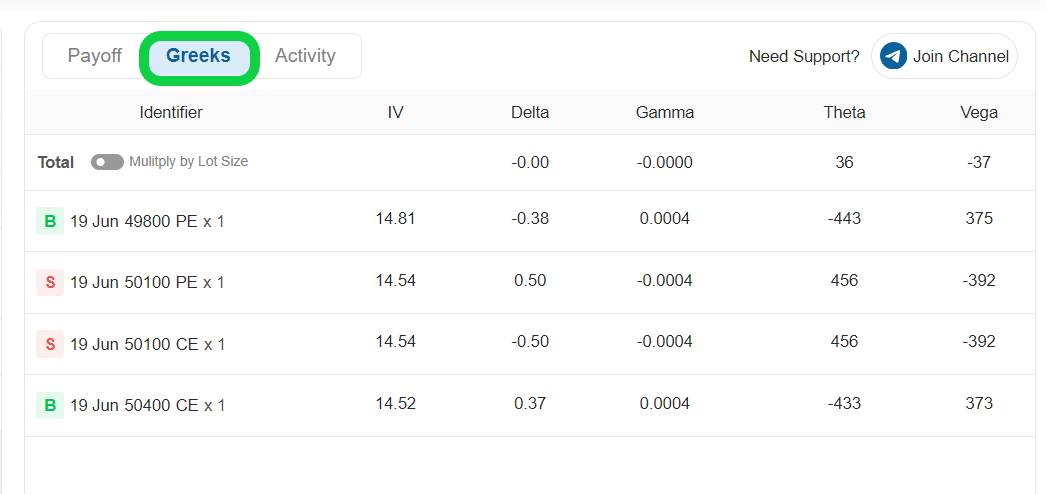
- In the Greeks section, the AlgoTest Simulator provides you with information about Option Greeks like Delta, Theta, Gamma, IV, Vega, etc. for your positions as shown in the image below.
Prebuilt Strategy Template
AlgoTest Simulator offers you some prebuilt strategy templates that you can use.
To access the Prebuilt strategy, follow some simple steps as shown below
- Click on the Simulator button on AlgoTest.
- Click on the position button as shown in the image below.
- Select the strategy you want to apply in AlgoTest's Options Simulator.
- You will be able to see that the strategy has been applied in the simulator as shown in the image below
Straddle
This strategy involves buying or selling options contracts with the same strike price and expiration date of the underlying asset. In a long straddle, a trader buys both a call and a put option. This strategy is used when the trader expects a significant price movement in either direction. On the other hand, in a short straddle, a trader sells both a call and a put option. This strategy is implemented when the trader expects the market to remain within a narrow range and not move significantly in either direction.
Strangle
This strategy involves buying or selling options contracts with different strike prices but the same expiration date of the underlying. In a long strangle, a trader buys a call and a put option. A trader implements a long strangle strategy when they expect a large price movement in either direction. In a short strangle, a trader sells a call and a put option. A trader implements a short strangle strategy when they expect the market to be within the range of the strikes they sell.
Bull Call Spread
A bull call spread is a trading strategy that entails purchasing a call option with a lower strike price and at the same time selling a call option with a higher strike price, both with the same expiration date. Typically, this involves buying an at-the-money (ATM) call option and selling an out-of-the-money (OTM) call option. The difference in strike prices depends on the level of aggressiveness you want for the trade. This strategy is suitable when you have a moderately bullish outlook on the underlying asset.
Bear Put Spread
A bear put spread is a trading strategy that entails purchasing a put option with a higher strike price and at the same time selling a put option with a lower strike price, both with the same expiration date. Typically, this involves buying an At-The-Money (ATM) Put Option and selling an Out-of-The-Money (OTM) Put Option. The difference in strike prices depends on how aggressive you want the trade to be. This strategy is suitable when you have a moderately bearish outlook on the financial instrument.
Iron Fly
The Iron Fly strategy is a multi-leg options strategy that includes selling at-the-money (ATM) call and put options while simultaneously buying out-of-the-money (OTM) call and put options with the same expiration date. This strategy is suitable when you expect the underlying asset to remain within a narrow price range. Traders realize the maximum profit when the market stays near the ATM strike sold by the traders.
Iron Condor
The Iron Condor is a multi-leg options strategy that includes selling out-of-the-money (OTM) calls and put options while also buying even further OTM calls and put options with the same expiration date. This strategy aims to be delta-neutral, meaning that traders can potentially profit more when the market remains stable and doesn't move significantly in either direction. The maximum profit is achieved when the market stays within the range of the sold call and puts strike prices.
Advanced Strategy Options
Once you're comfortable with basic strategy creation, you can venture into the world of advanced options strategies. These strategies involve combining multiple option contracts to achieve specific goals, such as limiting risk, generating income, or profiting from a range-bound or directional market.
Here's an overview of some popular advanced strategies you can explore within your AlgoTest Simulator:
Calendar Spread
This strategy involves buying and selling options contracts with the same strike price but different expiration dates. It allows you to capitalize on time decay (Theta) and potentially profit even if the underlying asset price doesn't move significantly.
Bull Put Spread
A bull put spread involves buying a put option with a lower strike price and simultaneously selling a put option with a higher strike price, both having the same expiration date. Normally, it involves buying an out-of-the-money (OTM) put option and selling an in-the-money (ITM) put option. The difference in strike depends on the aggressiveness of the trade you want to take. You can implement this strategy when you are moderately bullish on the instrument.
Bear Call Spread
A bear call spread involves buying a call option with a higher strike and selling a call option with a lower strike, both expiring on the same date. Normally, it involves buying an out-of-the-money (OTM) call option and selling an in-the-money (ITM) call option. The difference in strike depends on the aggressiveness of the trade you want to take. You can implement this strategy when you are moderately bearish on the instrument.
Ratio Spread
A ratio spread is an advanced options strategy in which a trader holds a different number of long and short options. As the name suggests, the buy and sell options are held in a specific ratio, such as 2:1, where 2 quantities can be short options and 1 quantity can be a long option. This strategy involves buying an at-the-money (ATM) call or put option and selling more than one quantity of the same option. It is typically implemented when the market is expected to remain relatively stable. However, there are different variations of the ratio spread that can be used if you are slightly bullish or bearish in the market.
Diagonal Call/Put Strategy
This strategy is an advanced version of the Calendar Spread. It involves buying or selling options with different strike prices and expiration dates. It is created by selling or buying an in-the-money (ITM) call or put option for the current week and selling or buying an out-of-the-money (OTM) option for the same underlying asset for the following week. This strategy is used when traders have neutral bearish or bullish views.
Futures + Options Combined Strategy
The AlgoTest Simulator feature allows you to incorporate futures contracts into your options strategies. Futures contracts represent an agreement to buy or sell an underlying asset at a specific price by a certain date. By including futures in your strategy, you can create more advanced structures that cater to diverse market outlooks.
For instance, you might combine an ATM long call option (bullish) with a short future contract (completely bearish) of the same underlying to create a strategy that profits if the underlying asset price decreases but limits your potential losses if it skyrockets.
Experimenting with different futures combinations within the Simulator allows you to explore a wider range of options and strategies and tailor them to your specific market views.
Analysing the Strategy
The AlgoTest Simulator offers traders the flexibility to comprehensively analyse their trading strategies, enabling them to develop advanced strategies customised to their unique risk profiles.
Unleash the power of advanced insights and tools for analysing option strategies!
Payoff Graph
AlgoTest Simulator displays a payoff graph alongside your chosen options. This graph is a powerful tool that visually represents the potential profit or loss you can expect at different underlying asset prices on the expiration date.
Here's how to interpret the payoff graph:
-
X-axis: Represents the price of the underlying asset.
-
Y-axis: Represents your potential profit or loss.
-
Line: The line on the graph depicts your strategy's current payoff at different underlying asset prices.
-
Blue Line: The line represents your potential profit and loss at different underlying prices on the expiry date.
By analysing the payoff graph, you can assess the potential risk-reward profile of your strategy before committing to real capital. It allows you to visualise how much you could potentially gain under various market scenarios and identify your maximum potential loss.
Total MTM
It displays the current total profit or loss (realised + unrealized) of your strategy. It helps you to visualise the running MTM in real time and make adjustments and trade decisions based on your strategy's PNL.
Maximum Profit
It shows the maximum profit your strategy can achieve by expiration if the market moves in your favour. You can use this information to adjust your strategy according to your desired maximum reward.
Risk/Reward
The risk-reward ratio shows how the risk in your strategy compares to the potential reward. It is calculated by dividing the risk by the potential reward. By understanding your risk tolerance, you can use this information to create a strategy that provides a good potential reward for the level of risk you are comfortable with.
Maximum Loss
It displays the potential maximum loss that your strategy may face if the market moves in the opposite direction of your prediction. This information can assist you in developing a strategy that matches your risk tolerance.
Margin Approx
It indicates the approximate margin required to execute this strategy with the broker, providing advance knowledge to avoid margin calls.
Breakeven
The breakeven point represents the price at which your position would result in neither profit nor loss upon expiration. In the accompanying image, the breakeven range spans from 22553 to 22847. Should the underlying asset close near these values, no profit or loss would be incurred. However, should it fall below 22553 or exceed 22847, losses would begin to accrue.
POP
POP stands for Probability of Profit, indicating the likelihood of earning at least $0.01 in profit from the specified strategy.


