How to Create and Backtest a Range Breakout Strategy
These strategies are for demonstration purposes only and are not intended for actual trading. AlgoTest is not responsible for any profit or loss arising from the use of these sample strategies.
A range breakout strategy is a type of trading strategy where we identify the high and low of a specific candle, which could be on a 5-minute, 15-minute, or any other time frame chart, and then wait for the price to break out of this range. If the price breaks above the high of the range, we take a bullish trade, and if the price breaks below the low of the range, we take a bearish trade.
Requirement for Backtesting on AlgoTest
For backtesting on AlgoTest, you need:
- An AlgoTest account
- A Strategy Logic
Creating & Backtesting a Range Breakout Strategy
To create any strategy, you should first have sound logic or an idea on which you want to base and backtest the strategy. To get an idea, you can view past charts of the instrument and observe how the market is behaving and which patterns are occurring frequently. Based on these patterns, you can generate an idea.
For example, if we look at the charts these days, we see that the market often makes significant movements in the last half an hour before closing. This observation could lead us to create a breakout option selling strategy to capitalize on the momentum of the last hour. Now that we have the idea of creating a breakout strategy, the next question is under what conditions we take entry or exit.
Entry & Exit Logic
Our strategy logic is straightforward. We will implement a 15-minute candle range breakout strategy on Nifty. First, we will choose the 15-minute candle at 02:45 on the one-strike-away ITM CE & PE option chart, which means the candle will be from 02:45 to 03:00. We will note the low of this candle and patiently wait for the price to break the low. If the price breaks the low of our CE strike, we will sell the CE option of the same strike. Similarly, if the price breaks the low of our PE strike, we will sell the PE option.
PE Entry & Exit Explained :-
We will choose one strike away In the Money (ITM) PE option chart for the Nifty at 02:45. We will mark the low of the 02:45 candle on the 15-minute time frame, which is the low of the 15-minute range from 02:45 to 03:00. We will wait for the low to break, and if it does, we will enter a Put Sell position of the same strike.
Our stop loss will be the high of the 02:45 candle, i.e., the high of the 02:45 to 03:00 range. So, after our entry, if the price breaks the high of the 02:45 candle, we will exit the trade.
CE Entry & Exit Explained :-
We will select a one-strike-away In the Money (ITM) CE option chart for the Nifty index at 2:45 PM and mark the low of the 02:45 PM candle on a 15-minute time frame, which is the low of the 15-minute range from 02:45 to 03:00. We will wait for the low to break. If it breaks, we will enter a Call-Sell position of the same strike.
Our stop loss will be the high of the 2:45 PM candle, which is the high of the 2:45 PM to 3:00 PM range. Therefore, after entering the trade, if the price breaks the high of the 2:45 PM candle, we will exit the trade.
BackTesting Candle Breakout Strategy in AlgoTest
To backtest our candle breakout strategy follow the simple steps as shown below:-
-
Create an account at https://algotest.in.
-
You will get 25 free backtests every week.
-
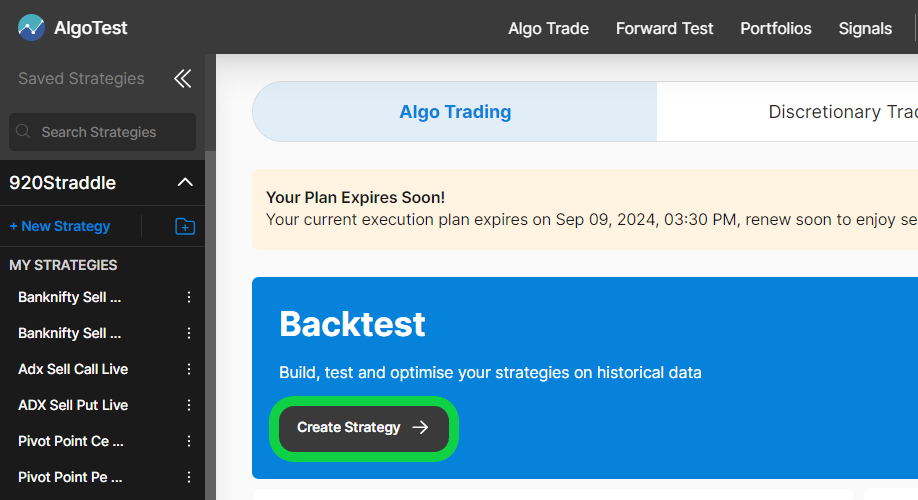
To Create a strategy, first Click on Create Strategy on the AlgoTest dashboard as shown in the image below.
- It will open a new strategy creation page as shown in the image below
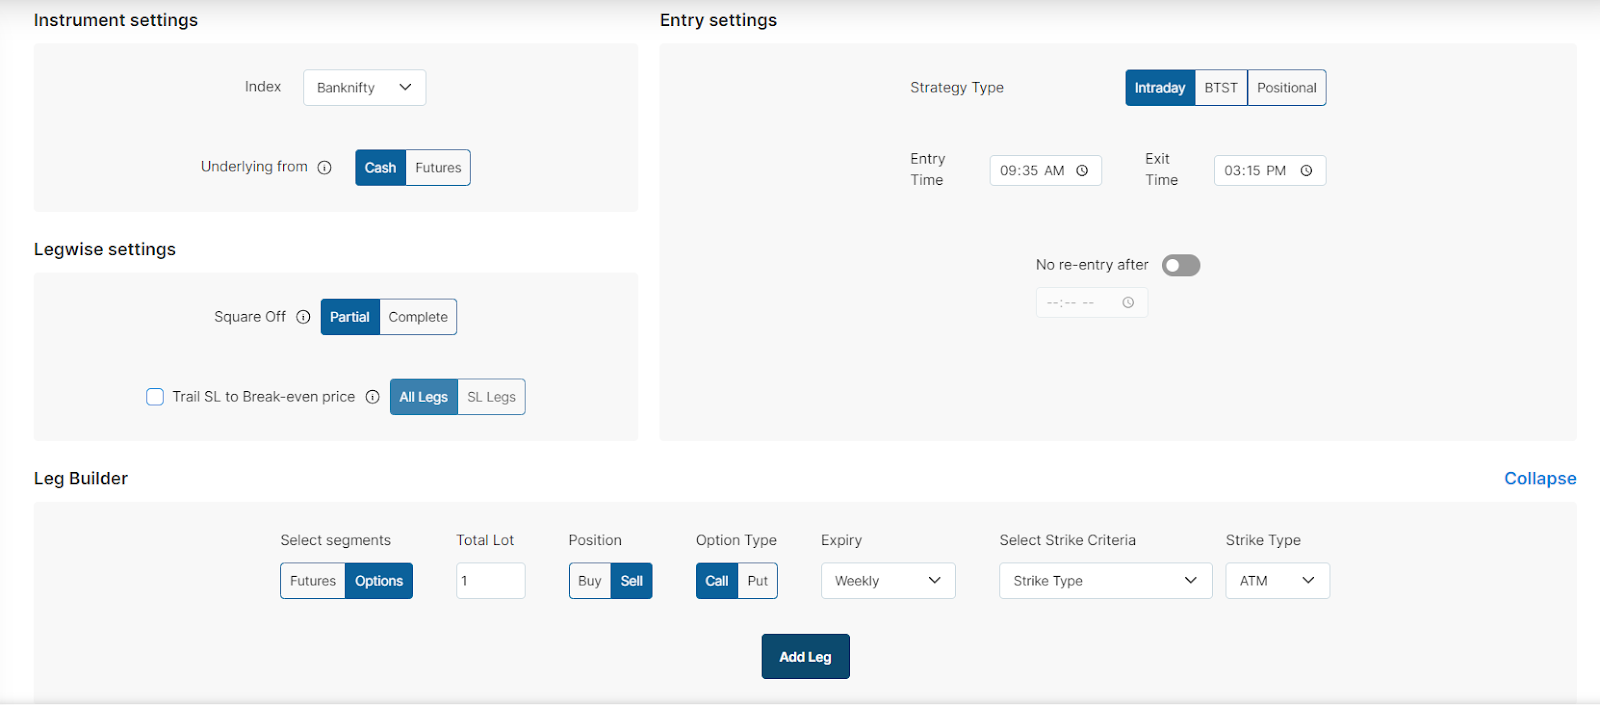
- Let me explain some of the features of the Instrument Settings & Entry Settings Section you should know about to create this strategy.
Strategy Type:- Intraday/BTST/Positional:- We have the option if we want to create an Intraday strategy or positional.
Entry Time:- The time at which we want to initiate our strategy condition.
Exit Time:- The time at which we want to exit our positions.
Select Index:- Here we can select the instrument ( For example nifty/bank nifty/Sensex etc)
Underlying From:- Cash/futures:- If we select cash it means our strikes will be selected based on index spot price or futures price.
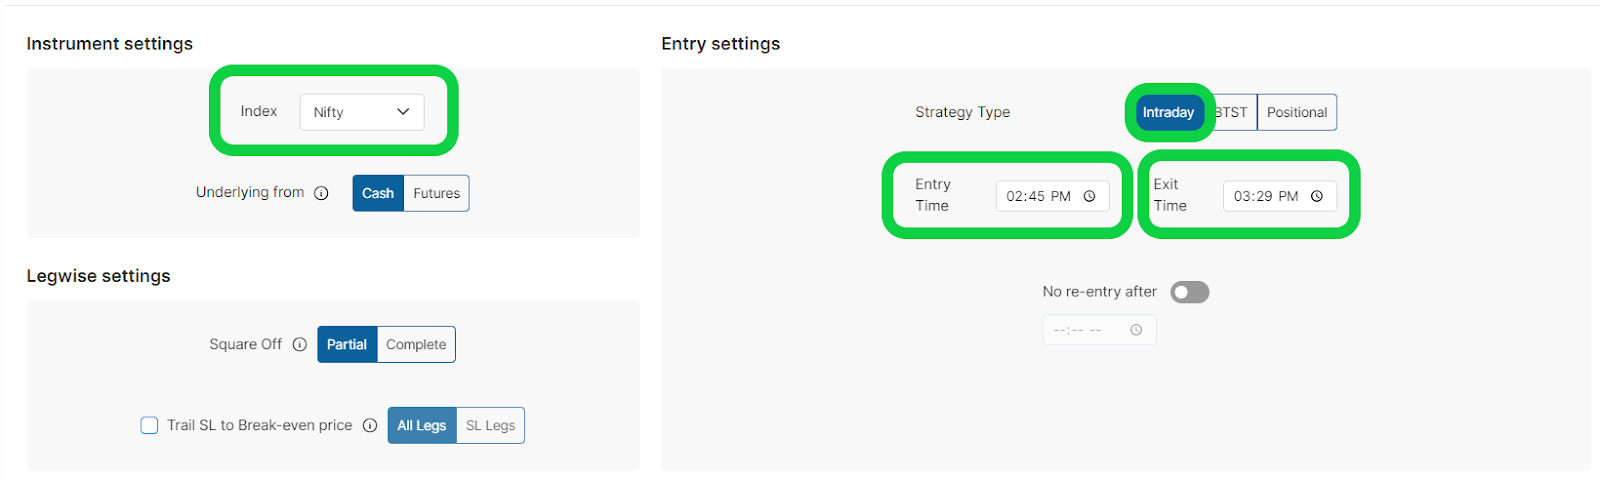
- According to our Strategy, we are going to enter
Strategy Type:- Intraday
Entry Time:- 02:45 (As our range is 02:45 to 03:00)
Exit Time:- 3:29 (As it is an intraday strategy, therefore we will exit at 03:29)
Index:- Nifty
Underlying:- Cash
- Set up these as shown in the image below
- Let me explain some more features of Leg Builder you should know about to create this strategy.
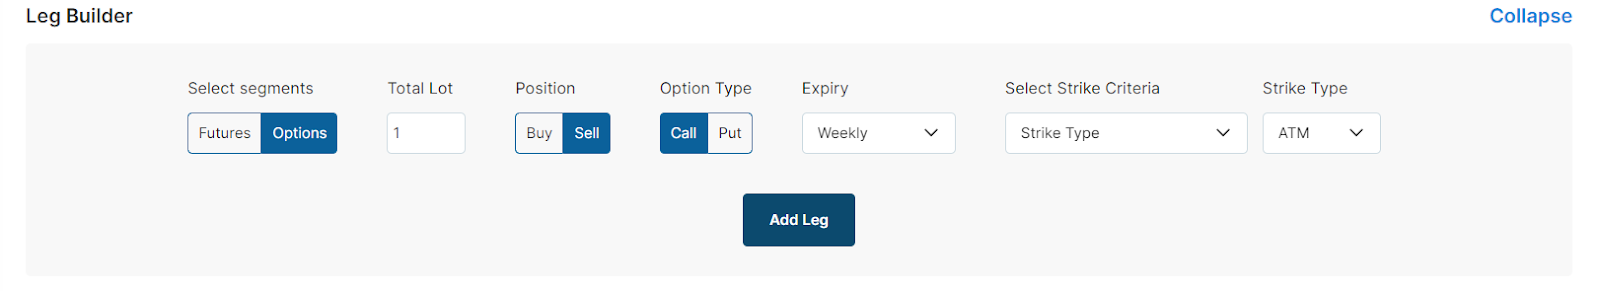
Select Segments:- You can select segments between Options/Futures
Total lot:- Enter the Quantity
Position:- Can select if you want to buy an option/futures or sell an option/futures
Option Type:- Can select between Call/put
Expiry:- Option to select if you want to trade this week's expiry/ next week's expiry/ monthly expiry
Select Strike Criteria:- Different Methods to select a strike
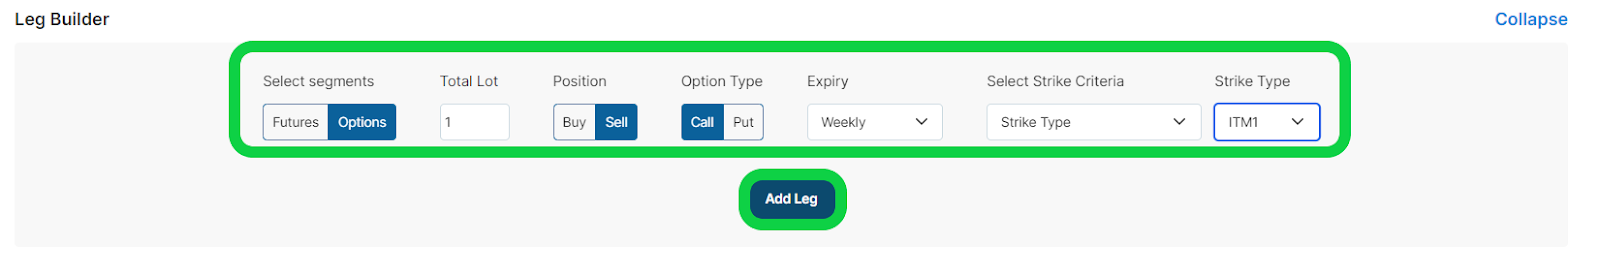
- Now we have to add a call leg from the leg builder. So, According to our Strategy, we are going to enter
Select Segments:- Options ( Because we want to trade in options)
Total Lot:- 1 (Quantity we want to test with 1 lot)
Position:- Sell (We are Selling Option here.)
Option Typing:- Call (First we add a Call leg then in the next step we will add a Put leg)
Expiry:- Weekly (We want to trade only in the current week's expiry)
Select Strike Criteria:- Strike Type:- ITM 1 (We want to select a strike which is 1 strike In The Money)
- Set up the above settings as shown in the image below.
- After setting up the condition as shown in the above image, click on Add Leg. It will show you the interface as shown in the below image.
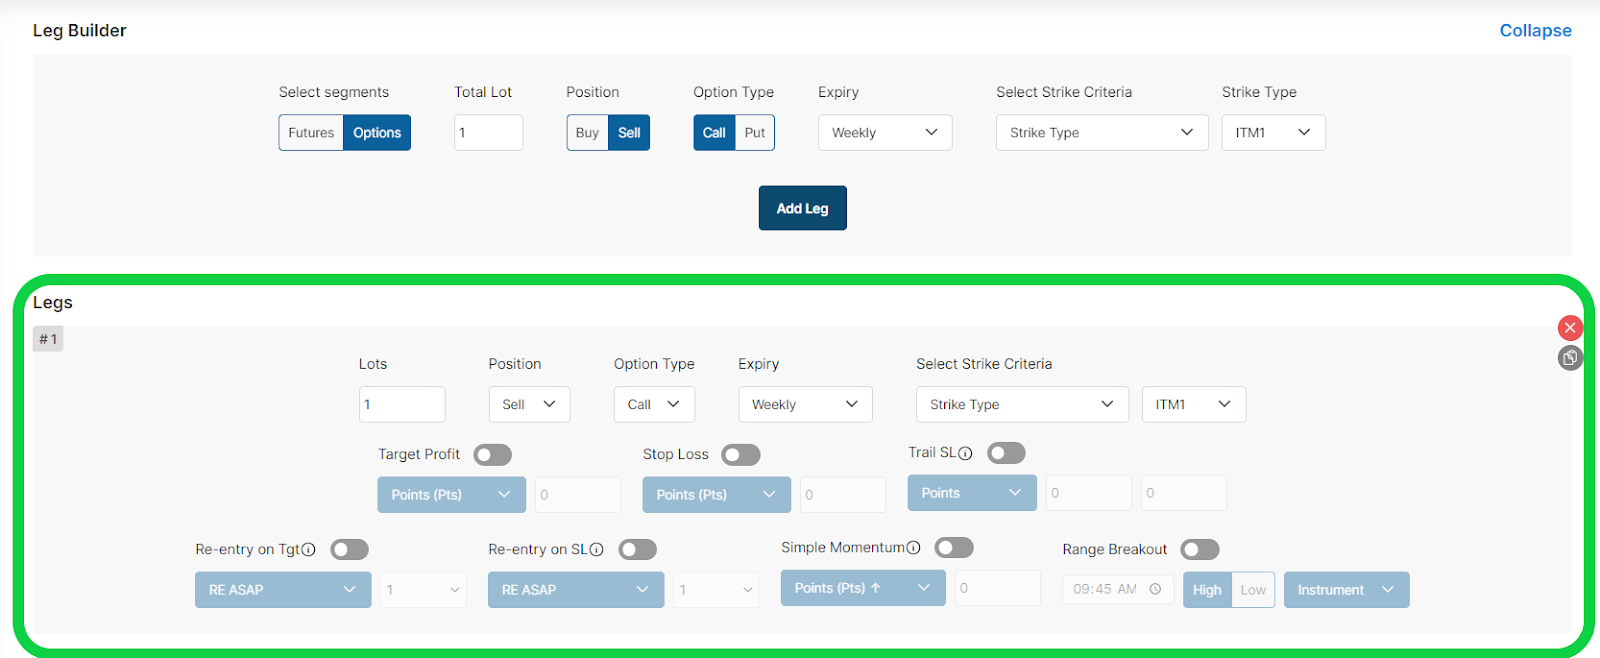
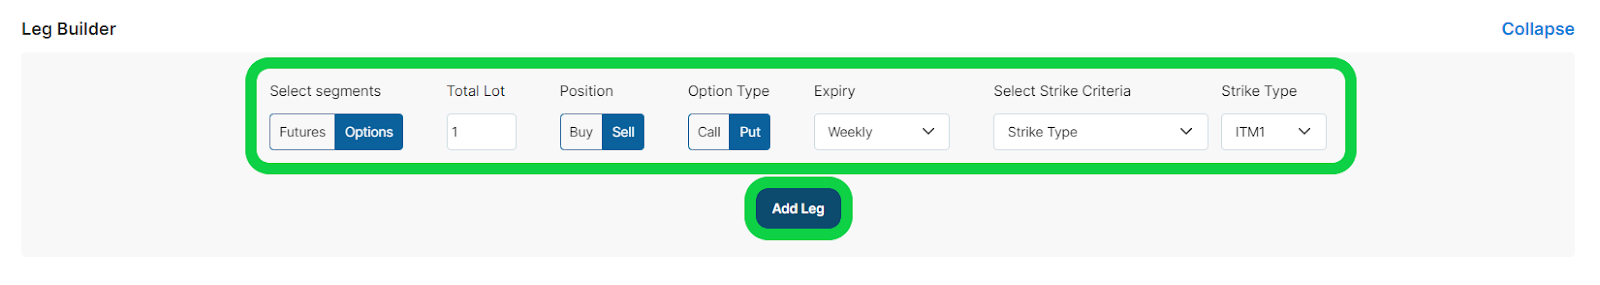
- In the above settings, we have added a Call leg from leg builder. Now we are going to add a Put Leg from Leg Builder. So enter the below settings in Leg Builder & click on add leg.
Select Segments:- Options ( Because we want to trade in options)
Total Lot:- 1 (Quantity we want to test with 1 lot)
Position:- Sell (We are Selling options here)
Option Typing:- Put (Want to Add Put Leg Now)
Expiry:- Weekly (We want to trade only in the current week's expiry)
Select Strike Criteria:- Strike Type:- ITM 1 (We want to select a strike which is 1 strike In The Money)
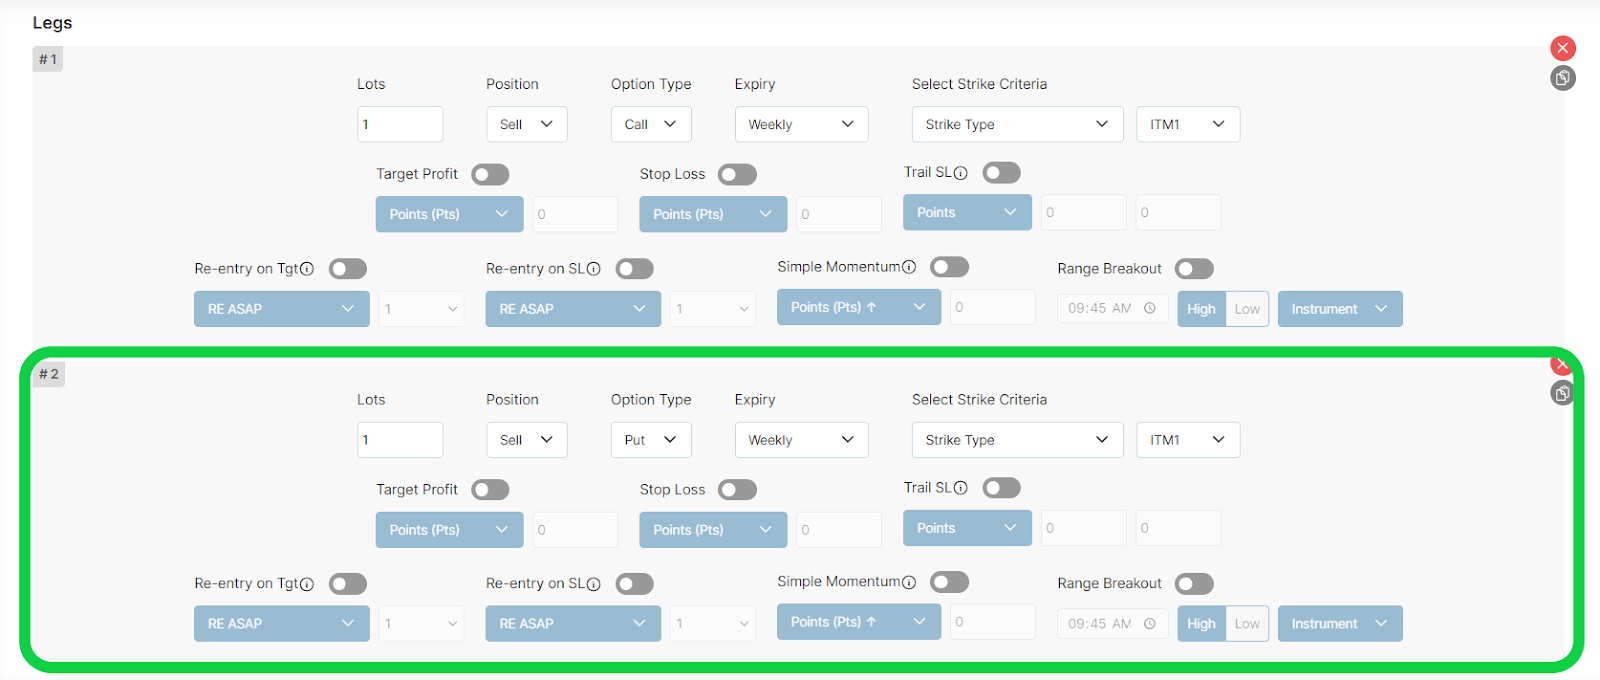
- After Clicking on Add leg, it will show you the interface as shown in the image below
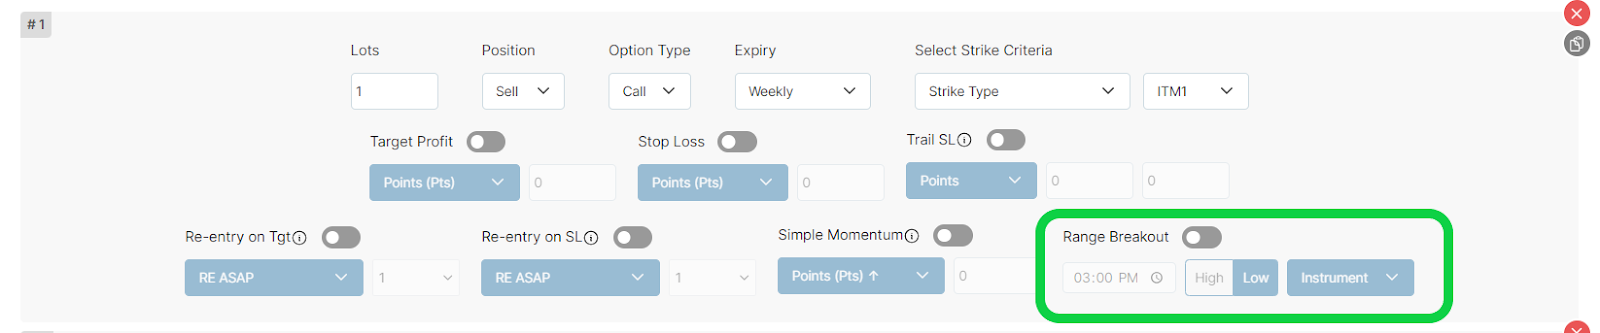
- We aim to mark a low 15-minute range of CE and PE and want to trade when the range breaks, so we will enable the range breakout feature as shown in the image below for the CE leg first.
-
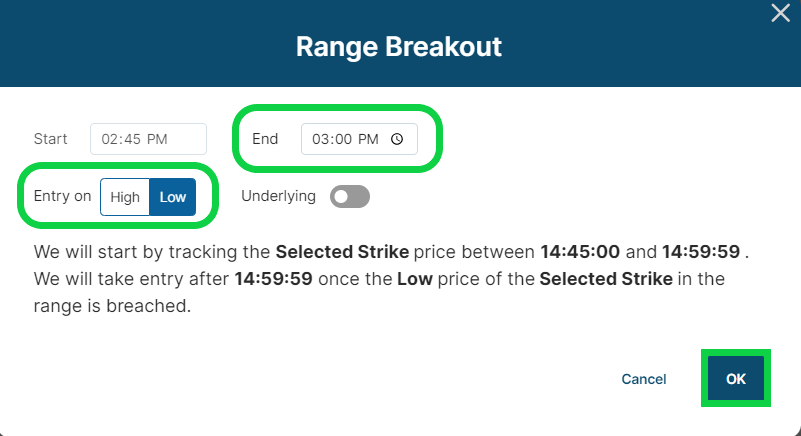
When we enable the range breakout option, a prompt will appear, asking us to choose the range we want to select. Since we want to select the low of the range from 02:45 to 03:00, we should remember that we already selected the initial range at the entry time when we initially created this strategy. Now, for the ending range, we need to input 03:00 and select 'low' in the high/low option, then click on the OK button. Currently, we are selecting the price range on the option chart, so we will not enable the underlying option as shown below. If you prefer the candle range to be based on index spot data, you can enable this underlying option.
-
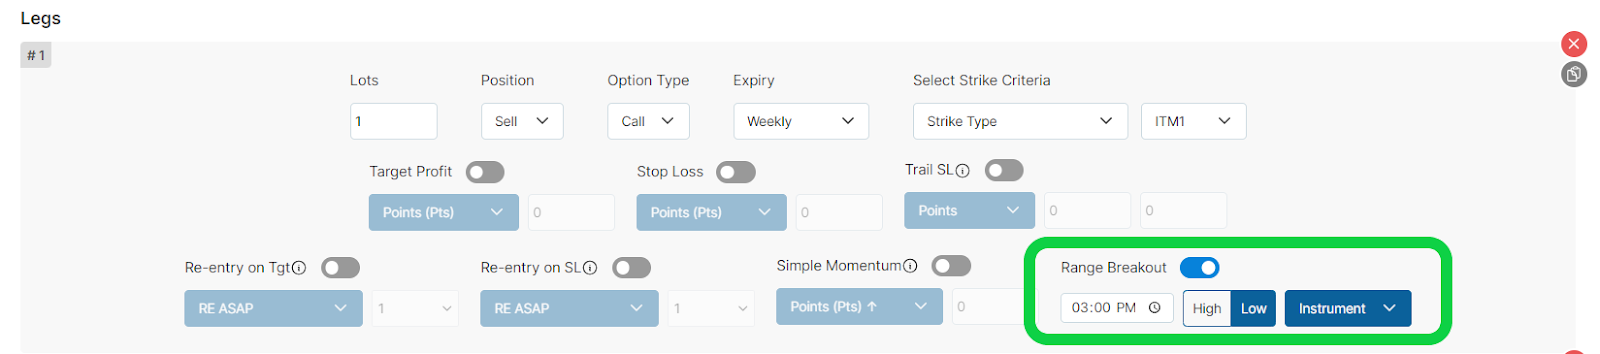
Once you click the OK button, it will display the range breakout inputs for the CE leg, as shown in the image below.
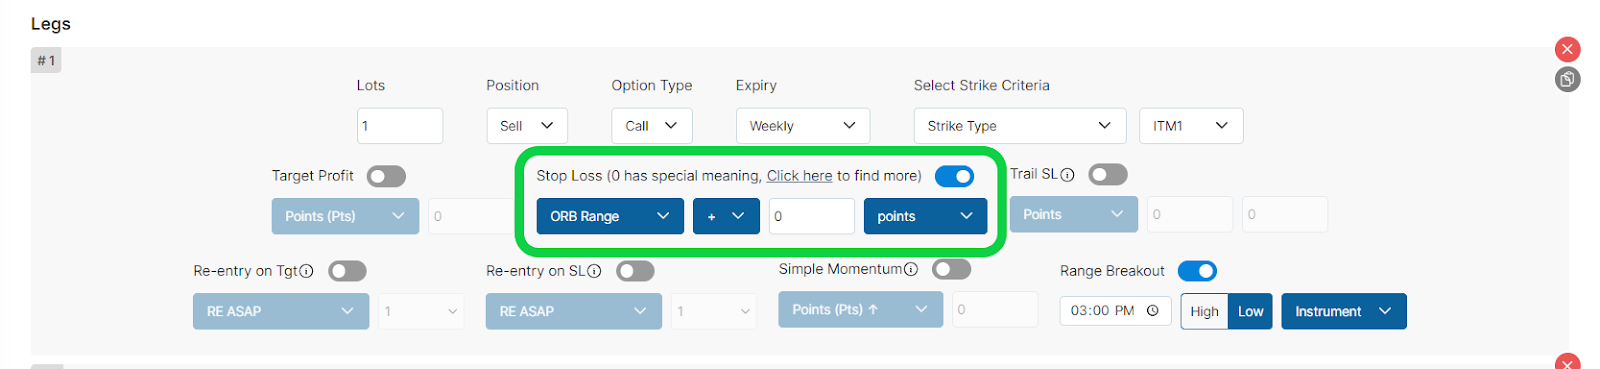
- Now we will add a stop loss to our strategy, which will be the candle high. To do this, we will enable the stop loss option and select "range breakout" from the dropdown as shown below.
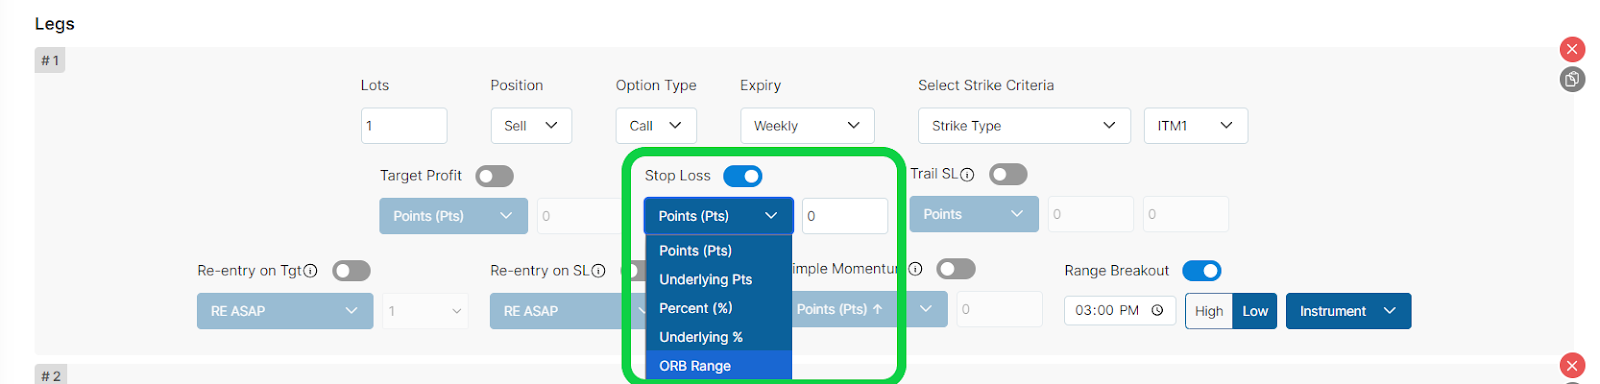
- We will set our stop loss at the high of the candle, which will be the same distance from our entry price as the total opening range breakout (ORB) range. We will express our stop loss in terms of the ORB range. We will select our stop loss to be the same as the ORB Range as indicated in the image below.
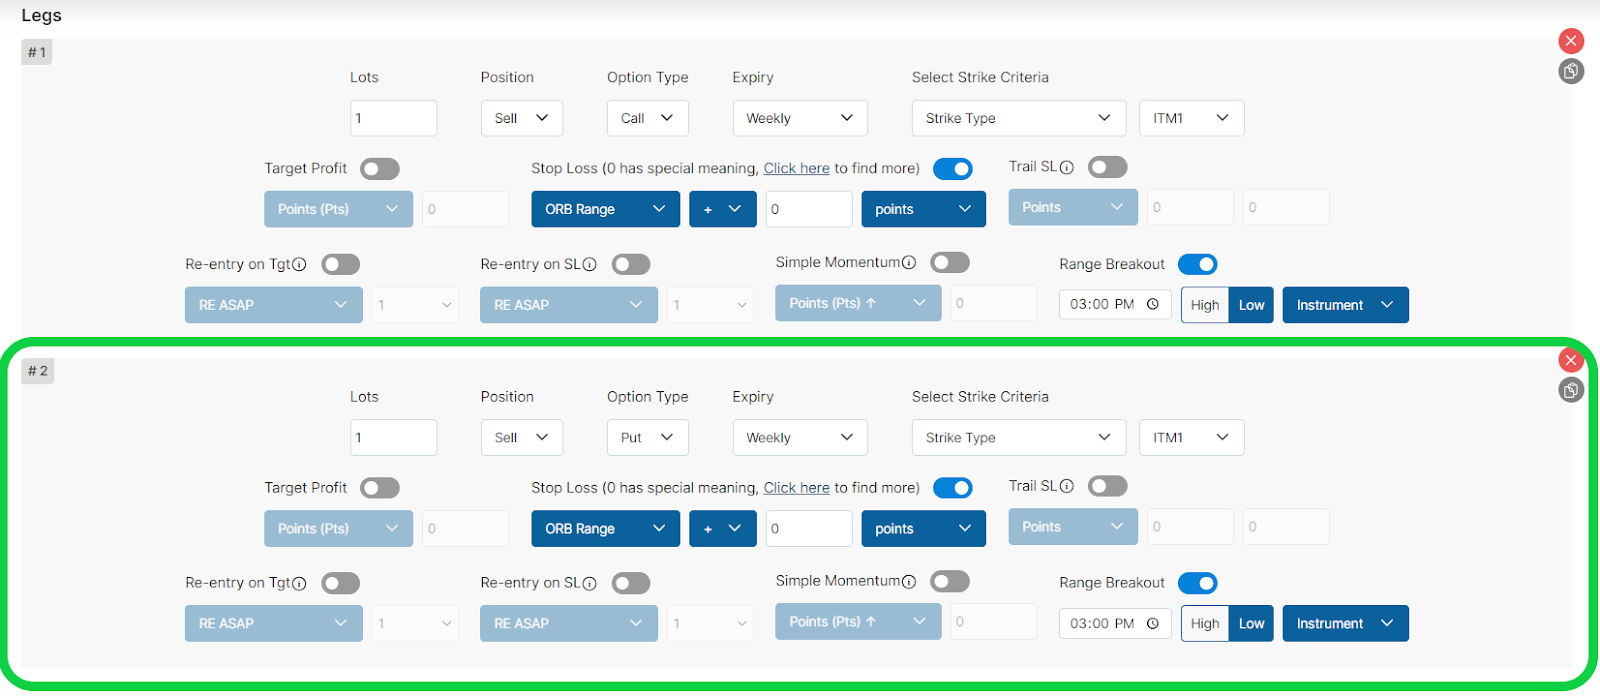
- As we have set up entry and exit for the CE leg, we will follow the same process for the PE leg and complete the setup as shown in the image below.
- To save the strategy, click on the save button located on the bottom right, and then save it with any name you like (for example, "Range Breakout Strategy"). To backtest the strategy, choose the desired period and click on backtest, as shown in the image below.


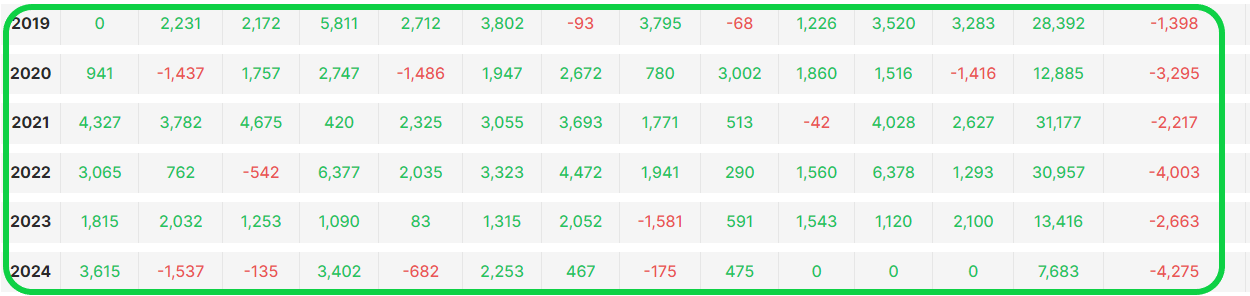
- It will show you the backtest results and stats of this strategy as shown in the image below. To know how to interpret these stats please click here.
The strategy presented in this blog is for demonstration purposes only, to illustrate how you can turn an idea into a strategy. You can use the idea from this strategy and further enhance it based on your risk tolerance.