Understanding a Portfolio BackTest Report?
Understanding how to read a portfolio backtest report is essential for traders looking to refine their strategies and improve their trading outcomes. Whether you are a seasoned trader or a beginner, mastering the art of reading backtest reports will enhance your analytical skills and increase your chances of success in the financial markets. This doc aims to demystify the components of a portfolio backtest report, helping you to interpret the results accurately and make more informed trading decisions.
Aggregate BackTest Result
AlgoTest offers users the ability to view the combined backtest results on a "per trade" basis or a "per period" basis separately. "Per Trade Basis" means that AlgoTest will treat trades from each strategy as separate trades when calculating the backtest results. On the other hand, "Per Period Basis" means that AlgoTest will consider all trades from different strategies within a day as one when calculating the backtest results.
Per Trade Basis (Intraday Strategies)
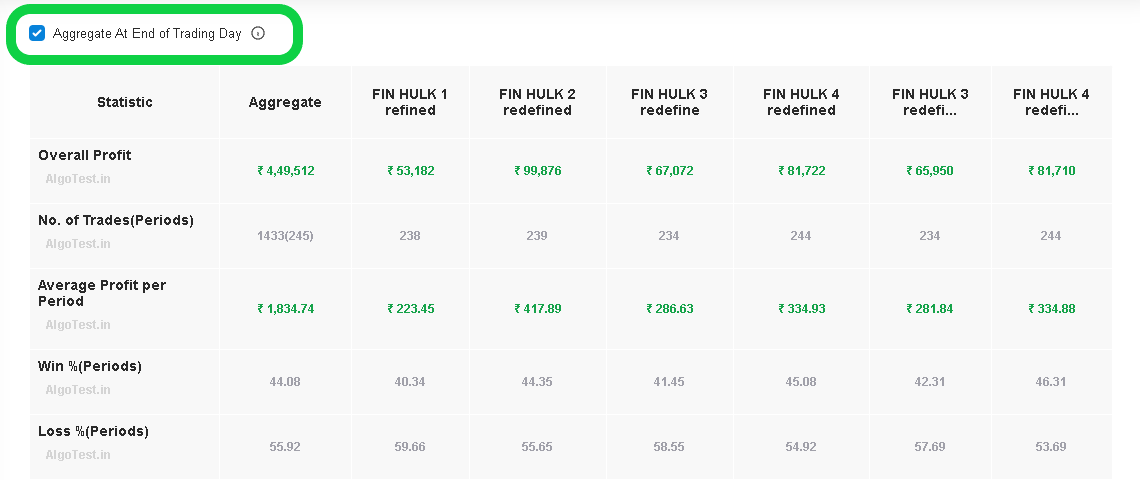
"Per Trade" means exactly what it sounds like - we treat every trade of each strategy in the portfolio as a standalone trade, and then calculate the results. You can view this by unchecking the box that says "Aggregate At End of Trading Day" located right above your portfolio result :

Let's learn this with a simple example. We have taken the daily P&L of two separate strategies in the sheets below.
| Date | Strategy #1 | Strategy #2 |
|---|---|---|
| 2 May, 2022 | -386 | 300 |
| 3 May, 2022 | 83 | 559 |
| 4 May, 2022 | 389 | 268 |
| 5 May, 2022 | -156 | 220 |
| 6 May, 2022 | -316 | -274 |
| 9 May, 2022 | -388 | 32 |
| 10 May, 2022 | 75 | 235 |
| 11 May, 2022 | 139 | -443 |
| 12 May, 2022 | -408 | 492 |
| Per Trade | Aggregate | Strategy #1 | Strategy #2 |
|---|---|---|---|
| Average Profit Per Trade | 23.38888889 | -107.5555556 | 154.3333333 |
| Win % | 61.11% | 44.44% | 77.78% |
| Loss % | 38.89% | 55.56% | 22.22% |
| Avg Profit on Winning Trade | 253.8181818 | 171.5 | 300.8571429 |
| Avg Loss in Losing Trade | -215.5454545 | -330.8 | -358.5 |
| Max Profit in Single Trade | 559 | 389 | 559 |
| Max Loss in Single Trade | -443 | -408 | 443 |
When results are aggregated on a "Per Trade" basis (Intraday Strategies):
In the sheet above, there are 9 trading days with 2 strategies in the portfolio. When we aggregate on a "Per Trade" basis, we will consider these as 18 separate data points to calculate our "Aggregate" column.
Let's use the example of calculating the Win% and Loss%. There are 7 trades that show a loss in the above sheet (5 in Strat 1 and 2 in Strat 2). Therefore, there are 11 winning trades. This means our Win% = 11/18 = 61.11%, and our Loss% = 7/18 = 38.89%.
Per Period Basis (Intraday Strategies)
"Per Period" means that all the strategies executed in a day will be considered as one when calculating backtest results. You can view this by checking the box that says "Aggregate At End of Trading Day" located right above your portfolio result.

Let's understand this with a simple example. We have taken the daily P&L of two separate strategies in the sheets below.
| Date | Strategy #1 | Strategy #2 | Day's PNL |
|---|---|---|---|
| 2 May, 2022 | -386 | 300 | -86 |
| 3 May, 2022 | 83 | 559 | 642 |
| 4 May, 2022 | 389 | 268 | 657 |
| 5 May, 2022 | -156 | 220 | 64 |
| 6 May, 2022 | -316 | -274 | -590 |
| 9 May, 2022 | -388 | 32 | -356 |
| 10 May, 2022 | 75 | 235 | 310 |
| 11 May, 2022 | 139 | -443 | -304 |
| 12 May, 2022 | -408 | 492 | 84 |
| Per Period | Aggregate | Strategy #1 | Strategy #2 |
|---|---|---|---|
| Average Profit Per Period | 46.77777778 | -107.5555556 | 154.3333333 |
| Win % | 55.56% | 44.44% | 77.78% |
| Loss % | 44.44% | 55.56% | 22.22% |
| Avg Profit on Winning Period | 351.4 | 171.5 | 300.8571429 |
| Avg Loss in Losing Period | -267.2 | -330.8 | -358.5 |
| Max Profit in Per Period | 657 | 389 | 559 |
| Max Loss in Per Period | -590 | -408 | 443 |
When results are aggregated on a "Per Period" basis(Intraday Strategies)
We will use the Daily PnL column in the above sheet. Let's recalculate the Win% and Loss%.
When calculating based on Per Trade, we had a total of 18 data points treating each trade of each strategy as separate. On the other hand, with "Per Period," we only have 9 data points, representing the 9 trading days. Out of these 9 days, 4 were losing days and 5 were winning days. You can find this information in the "Daily PnL" column on the right side of the image.
So, Win% = 5/9 = 55.56%, and Loss% = 4/9 = 44.44%.
Per Trade Basis (Intraday + Positional)
If your portfolio includes both intraday and positional strategies, the Per Trade scenario will work the same as we have read above in the intraday section. It will consider each trade as a separate transaction.
Per Period Basis (Intraday + Positional)
If your portfolio consists of both intraday and positional strategies, the "Per Period" scenario will be interpreted as "Per Holding Period." For instance, if we are backtesting weekly positional strategies with a maximum holding period of 1 week, the strategies executed within 1 week will be considered as one period.
In this scenario, when a user selects "Aggregate at End of Trading Day" (i.e. on a "Per Period" basis), our Win% and Loss% will now represent the Weekly Win% and Loss%. Here is a sheet of this calculation:
| Date | Strategy #1 | Strategy #1 (Weekly PNL) | Strategy #2 Positional | Overall PNL (Weekly) |
|---|---|---|---|---|
| 2 May, 2022 | -386 | ||| | ||
| 3 May, 2022 | 83 | ||| | ||
| 4 May, 2022 | 389 | ||| | ||
| 5 May, 2022 | -156 | -70 | 2200 | 2130 |
| 6 May, 2022 | -316 | ||| | ||
| 9 May, 2022 | -388 | ||| | ||
| 10 May, 2022 | 75 | ||| | ||
| 11 May, 2022 | 139 | ||| | ||
| 12 May, 2022 | -408 | -898 | 1054 | -1952 |
| Per Period | Aggregate | Strategy #1 | Strategy #2 |
|---|---|---|---|
| Average Profit Per Period | 89 | -107.5555556 | 573 |
| Win % | 50% | 44.44% | 50% |
| Loss % | 50% | 55.56% | 50% |
| Avg Profit on Winning Period | 2130 | 171.5 | 2200 |
| Avg Loss on Losing Period | -1952 | -330.8 | -1054 |
| Max Profit in Single Period | 2130 | 389 | 2200 |
| Max Loss in Single Period | -1952 | -408 | -1054 |
"Per Period" Aggregation for a Positional Strategy
In the new column labeled "Strat 1 (Weekly)", we calculate the combined weekly profit of the strategy by adding the individual daily profit or loss of Strat 1. As of 5 May, Strat 1 had incurred a loss of Rs 70, and Strat 2 had generated a profit of Rs 2200. Therefore, the combined weekly profit of the strategy is -70 + 2200 = Rs 2130.
A similar calculation is carried out for the next week, and we now have 2 data points to calculate our Win% and Loss%. Since we made a profit in our first week and a loss in our second week, our Win% = Loss% = 50% in this case.
The fields such as Avg Profit on Winning Day, Avg Loss on Losing Day, etc. are now interpreted as "Avg Profit on Winning Week", "Avg Loss on Losing Week", etc.
Important Points
The following metrics for the portfolio are calculated on a per-period basis for intraday strategies. For intraday strategies, the holding period is 1 day, so strategies executed on a trading day is considered as one period. For positional strategies, the period value may differ, as the holding period is around 7 days or 28 days. Therefore, strategies executed within 1 week or 28 days are considered as one period.
Overall Profit
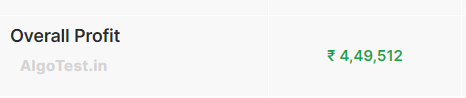
The overall profit indicates the combined backtest profit of the strategies in your portfolio for the specific backtested period. This is calculated by adding up the profits generated by the strategies during the backtesting period.
It is an important metric for evaluating backtest performance as it helps determine if the profit aligns with your trading style. This information enables you to make decisions about whether to continue with a particular strategy or not.
No. of Trades/Period
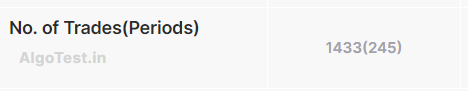
The "Number of Trades" shows the number of times a trading strategy is executed during a specific backtesting period. For instance, if there are six strategies executed on a trading day it is considered as 6 trades. However, if the same strategy is executed again as a re-entry, it is counted as another trade.
The "Number of Period" refers to the number of trading days for which strategies are executed. For instance, intraday strategies have a holding period of 1 day. Therefore, the number of periods for intraday strategies equals the number of trading days on which they executed. If any number of intraday strategies are executed on a trading day, it is considered as 1 period only.
Average Profit Per Period
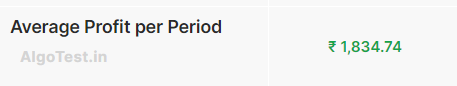
The "Average Profit Per Period" metric indicates the average profit earned per period. It is a very important metric as it suggests how much profit, on average, you make in each period. You can use this metric to design a strategy that suits your return expectations..
Let's consider a simple example to calculate this.
Overall Profit = 200000
Number of Periods = 100
Average Profit Per Period = Overall Profit / Number of Periods
Average Profit Per Period = 200000 / 100 = 2000
Win% (Periods)
It shows the percentage of periods during which you end up in profit compared to the total number of periods. This metric is very important as it indicates your profit percentage. You can use this information to create a strategy that suits your psychology. For example, if you tend to make a profit most of the time, even if it's a small profit, then you should consider creating a portfolio with a higher win percentage.
Let's consider a simple example to calculate this.
Total number of periods = 200
Number of profit periods = 120
Number of losing periods = 80
Win% = (Number of Profit Periods / Total Number of Periods) * 100
Win% (Periods) = (120 / 200) * 100 = 60%
Loss% (Periods)
It shows you the percentage of periods during which you ended up with a loss compared to the total number of periods. This percentage reflects the frequency of losses in your portfolio, which is a crucial metric as it helps you anticipate potential losses in the future. Based on this statistic, you can adjust your investment strategy to better align with your risk tolerance and financial goals.
Let's consider a simple example to calculate this.
Total Number of Periods = 200
Number of Profitable Periods = 120
Number of Losing Periods = 80
Loss Percentage = Number of Losing Periods / Total Number of Periods
Loss Percentage (Periods) = (80 / 200) * 100 = 40%
Average Profit on Winning Periods

It shows you the average profit your portfolio has made during winning periods. This metric is crucial as it provides insight into the average profit you can expect from your portfolio during winning periods, giving you valuable information about profit expectations.
Let's consider a simple example to calculate this.
Total Number of Periods = 10
Total Number of Winning Periods = 5
Overall Profit = 20000
Total Profit on Winning Periods = 25000
Average Profit on Winning Periods = Total Profit on Winning Periods / Total Number of Winning Periods
Average Profit on Winning Periods = 25000 / 5
Average Profit on Winning Periods = 5000
Average Loss on Losing Periods
This metric shows the average loss your portfolio has experienced during periods of loss. It is crucial as it provides insight into the average loss you can expect from your portfolio during losing periods. This helps you mentally prepare to expect an average loss on losing days or adjust your strategy if the loss is higher than expected.
Let's consider a simple example to calculate this.
Total Number of Periods = 10
Total Number of Losing Periods = 5
Total Loss on Losing Periods = 5000
Average Loss on Losing Periods = Total Loss on Losing Periods / Total Number of Losing Periods
Average Loss on Losing Periods = 5000 / 5
Average Loss on Losing Periods = 1000
Max Profit in a Single Period

The term "Max Profit in a Single Period" refers to the maximum profit experienced by a portfolio in a single day. It is an important figure because it indicates if a large portion of your overall profit comes from an outlier day. It's better to avoid portfolios where most of the profit comes from a single day.
For example, if you have developed and tested a portfolio from January 1, 2022, to January 5, 2022, and the results are as follows:
January 1, 2022: $500 profit
January 2, 2022: $800 profit
January 3, 2022: $700 loss
January 4, 2022: $600 profit
January 5, 2022: $200 loss
Then the maximum profit that the portfolio has experienced in a single period is $800.
Max Loss in a Single Period

The term 'Max Loss in a Single Period' refers to the maximum loss that a portfolio has experienced in a single day. It is a very crucial figure, which tells you the maximum loss you can expect in the future on any single day. For instance, if you have developed and tested a portfolio from January 1, 2022, to January 5, 2022, and the results are as follows:
January 1, 2022: $500 profit
January 2, 2022: $800 profit
January 3, 2022: $700 loss
January 4, 2022: $600 profit
January 5, 2022: $200 loss
Then the maximum loss that the portfolio has experienced in a single period is $700.
Max Drawdown

A maximum drawdown (MDD) refers to the highest observed loss from the highest point to the lowest point of a portfolio, before a new peak is reached. This is an important metric that indicates the potential downside risk over a specific time period. For instance, if you have backtested a portfolio from January 1st, 2022 to January 9th, 2022, tThe maximum drawdown provides a clear indication of the total loss your portfolio experienced during that period. This information allows you to adjust your strategies according to your risk tolerance.
| Date | Profit/Loss | Overall Portfolio Profit/Loss |
|---|---|---|
| 01/01/2022 | 1000 | 1000 |
| 02/01/2022 | -2000 | -1000 |
| 03/01/2022 | -1500 | -2500 |
| 04/01/2022 | 4000 | 1500 |
| 05/01/2022 | -5700 | -4200 |
| 08/01/2022 | -1300 | -5500 |
| 09/01/2022 | 7000 | 1500 |
| 10/01/2022 | 800 | 2300 |
In the table above, you can see that between January 1st, 2022 and January 4th, 2022, your portfolio initially peaked at 1000 before dropping to -2500, before eventually reaching a new peak of 1500 on January 4th, 2022. This means that the maximum drawdown during this period was 3500, which refers to the difference between the peak profit of 1000 and the lowest point of loss at -2500.
Following this, between January 5th, 2022 and January 10th, 2022, your overall strategy portfolio peaked again at 1500 before dropping to -5500, before reaching a new peak of 2300 on January 9th, 2022. This resulted in a maximum drawdown of 7000, which refers to the difference between the peak profit of 1500 and the lowest point of loss at -5500.
Therefore, you experienced 2 drawdowns during this period, with the first being 3500 and the second being 7000. However, the maximum drawdown throughout the entire period from January 5th, 2022 to January 8th, 2022 was 7000.
Duration of Max Drawdown

The term 'max drawdown duration' refers to the length of time during which your portfolio has experienced the greatest decline in value from its peak.
| Date | Profit/Loss | Overall Strategy Profit/Loss |
|---|---|---|
| 01/01/2022 | 1000 | 1000 |
| 02/01/2022 | -2000 | -1000 |
| 03/01/2022 | -1500 | -2500 |
| 04/01/2022 | 4000 | 1500 |
| 05/01/2022 | -5700 | -4200 |
| 08/01/2022 | -1300 | -5500 |
| 09/01/2022 | 4000 | 1500 |
| 10/01/2022 | 800 | 2300 |
Two drawdowns were faced by the portfolio in the table: the first was 3,500 and the second was 7,000. The maximum duration of the drawdown i.e. 7,000 was four days, from jan 5, 2022 to jan 8, 2022.
Return/Max DD
During the backtest period, return over max drawdown is calculated by dividing the overall profit by the maximum drawdown in the backtest period, and then dividing that by the number of years in the backtest period. The higher the value, the better.

As shown in the image above, the overall profit in 2019 was 51006 with a maximum drawdown of 7864. The returns to maximum drawdown ratio can be calculated as follows: Returns/Max Drawdown = 51006/7864, which results in 6.48.
Reward to Risk Ratio (Periods)

This displays the potential reward as compared to the potential risk of the portfolio. In simpler terms, it shows you how much reward you can earn for every rupee of risk taken. A higher ratio indicates that the strategy has the potential for bigger profits compared to the risk involved.
Let's consider a simple example to calculate this.
| Trades | Profit/Loss |
|---|---|
| 01/01/2023 | -400 |
| 02/01/2023 | 900 |
| 03/01/2023 | 1100 |
| 04/01/2023 | -600 |
Reward to Risk Ratio = Total Profit on profitable days/Total Loss on losing days
Reward to Risk Ratio = 1100+900/600+400
Reward to Risk Ratio = 2000/1000
Reward to Risk Ratio = 2
Expectancy Ratio
The Expectancy Ratio is a crucial metric that traders use to evaluate the effectiveness of their portfolio. It is determined by dividing the Average Win (AW) by the Average Loss (AL).
For instance, if the Average Profit Per Period is 500 and the Average Loss on Losing Period is 1000, the Expectancy Ratio can be calculated as follows:
Expectancy Ratio = Average Profit Per Period / Average Loss on Losing Period
Expectancy Ratio = 500 / 1000
Expectancy Ratio = 0.5
This means that, on average, for every 100 that is lost on losing days, 50 are earned back on average. Therefore, a trader may need to revise their trading strategies if the expectancy ratio is too low.
Max Win Streak (Periods)

The term 'Max Win Streak Per Period'' refers to the maximum count of consecutive profitable days, without any intervening losing trades.\
Max Losing Streak (Period)

The term 'Max Losing Streak Per Period'' refers to the maximum count of consecutive days that resulted in losses, without any winning trades in between them.
Max Days in Any Drawdown (Periods)

It refers to the Maximum number of days when your portfolio was in a drawdown phase. This drawdown phase need not be equal to your max drawdown(monetarily). It is a very important figure that helps to give an idea of the number of days your portfolio was in drawdown and whether you are able to handle this.
For instance, if you backtested a portfolio and the results are as shown in the table below:
| Drawdown No. | Loss | Number of Trading Days |
|---|---|---|
| Drawdown 1 | 5000 | 15 |
| Drawdown 2 | 7000 | 10 |
In the table above, you can see that there were 2 instances of drawdown in the portfolio. The first drawdown had 15 trading days, while the second had 10 trading days .
Although the second drawdown was bigger, the number of trading days in the first drawdown was more. Therefore, the maximum number of trades in any drawdown in this case is 15.