HeatMap Feature
Link to Heatmap : Click here!
Learn how to use the Heatmap Feature from a certified SEBI Research Analyst - Sandeep Rao!
What is the HeatMap Feature?
The HeatMap feature on AlgoTest offers traders an intuitive way to visualise profit and loss (P&L) trends for options strategies, particularly Short Straddles. By using heatmaps, traders can instantly identify patterns over different periods, gaining insights into which strategies have performed well or underperformed in the market. This feature is ideal for analysing up to 60 days of data across various indices such as Nifty, BankNifty, FinNifty, and MidcapNifty.
What is a Short Straddle?
A Short Straddle is a neutral options strategy where a trader sells both a call and a put option at the same strike price and expiration date. The strategy benefits when the price of the underlying asset stays close to the strike price, minimising volatility.
Why is there no data for Bankex and Sensex?
Currently, the data generated from Bankex and Sensex is unstable, which means meaningful heatmaps cannot be produced from this data. AlgoTest is working on stabilising the data and will introduce these indices when reliable results can be assured.
Indices Available
The HeatMap feature supports four main indices:
Nifty
BankNifty
FinNifty
MidcapNifty
Users can easily switch between these indices for their analyses. (Refer to Image 1 and Image 2 for Nifty and BankNifty examples.)
Requirements for Using the HeatMap Feature
To start using the HeatMap feature, the only requirement is:
An active AlgoTest account.
How to Use: Select Mode
The HeatMap offers three different modes for analysis:
- Time vs SL: Compare performance over various time slots and stop loss levels.
- Date vs Time: See how the Short Straddle strategy performed over a range of dates and time intervals.
- Date vs SL: Compare performance over various dates and stop loss levels.
Each mode serves a unique purpose, and you can switch between them depending on your analysis needs. Additionally, traders can choose from the four indices to compare data (e.g., Nifty, BankNifty, etc.).
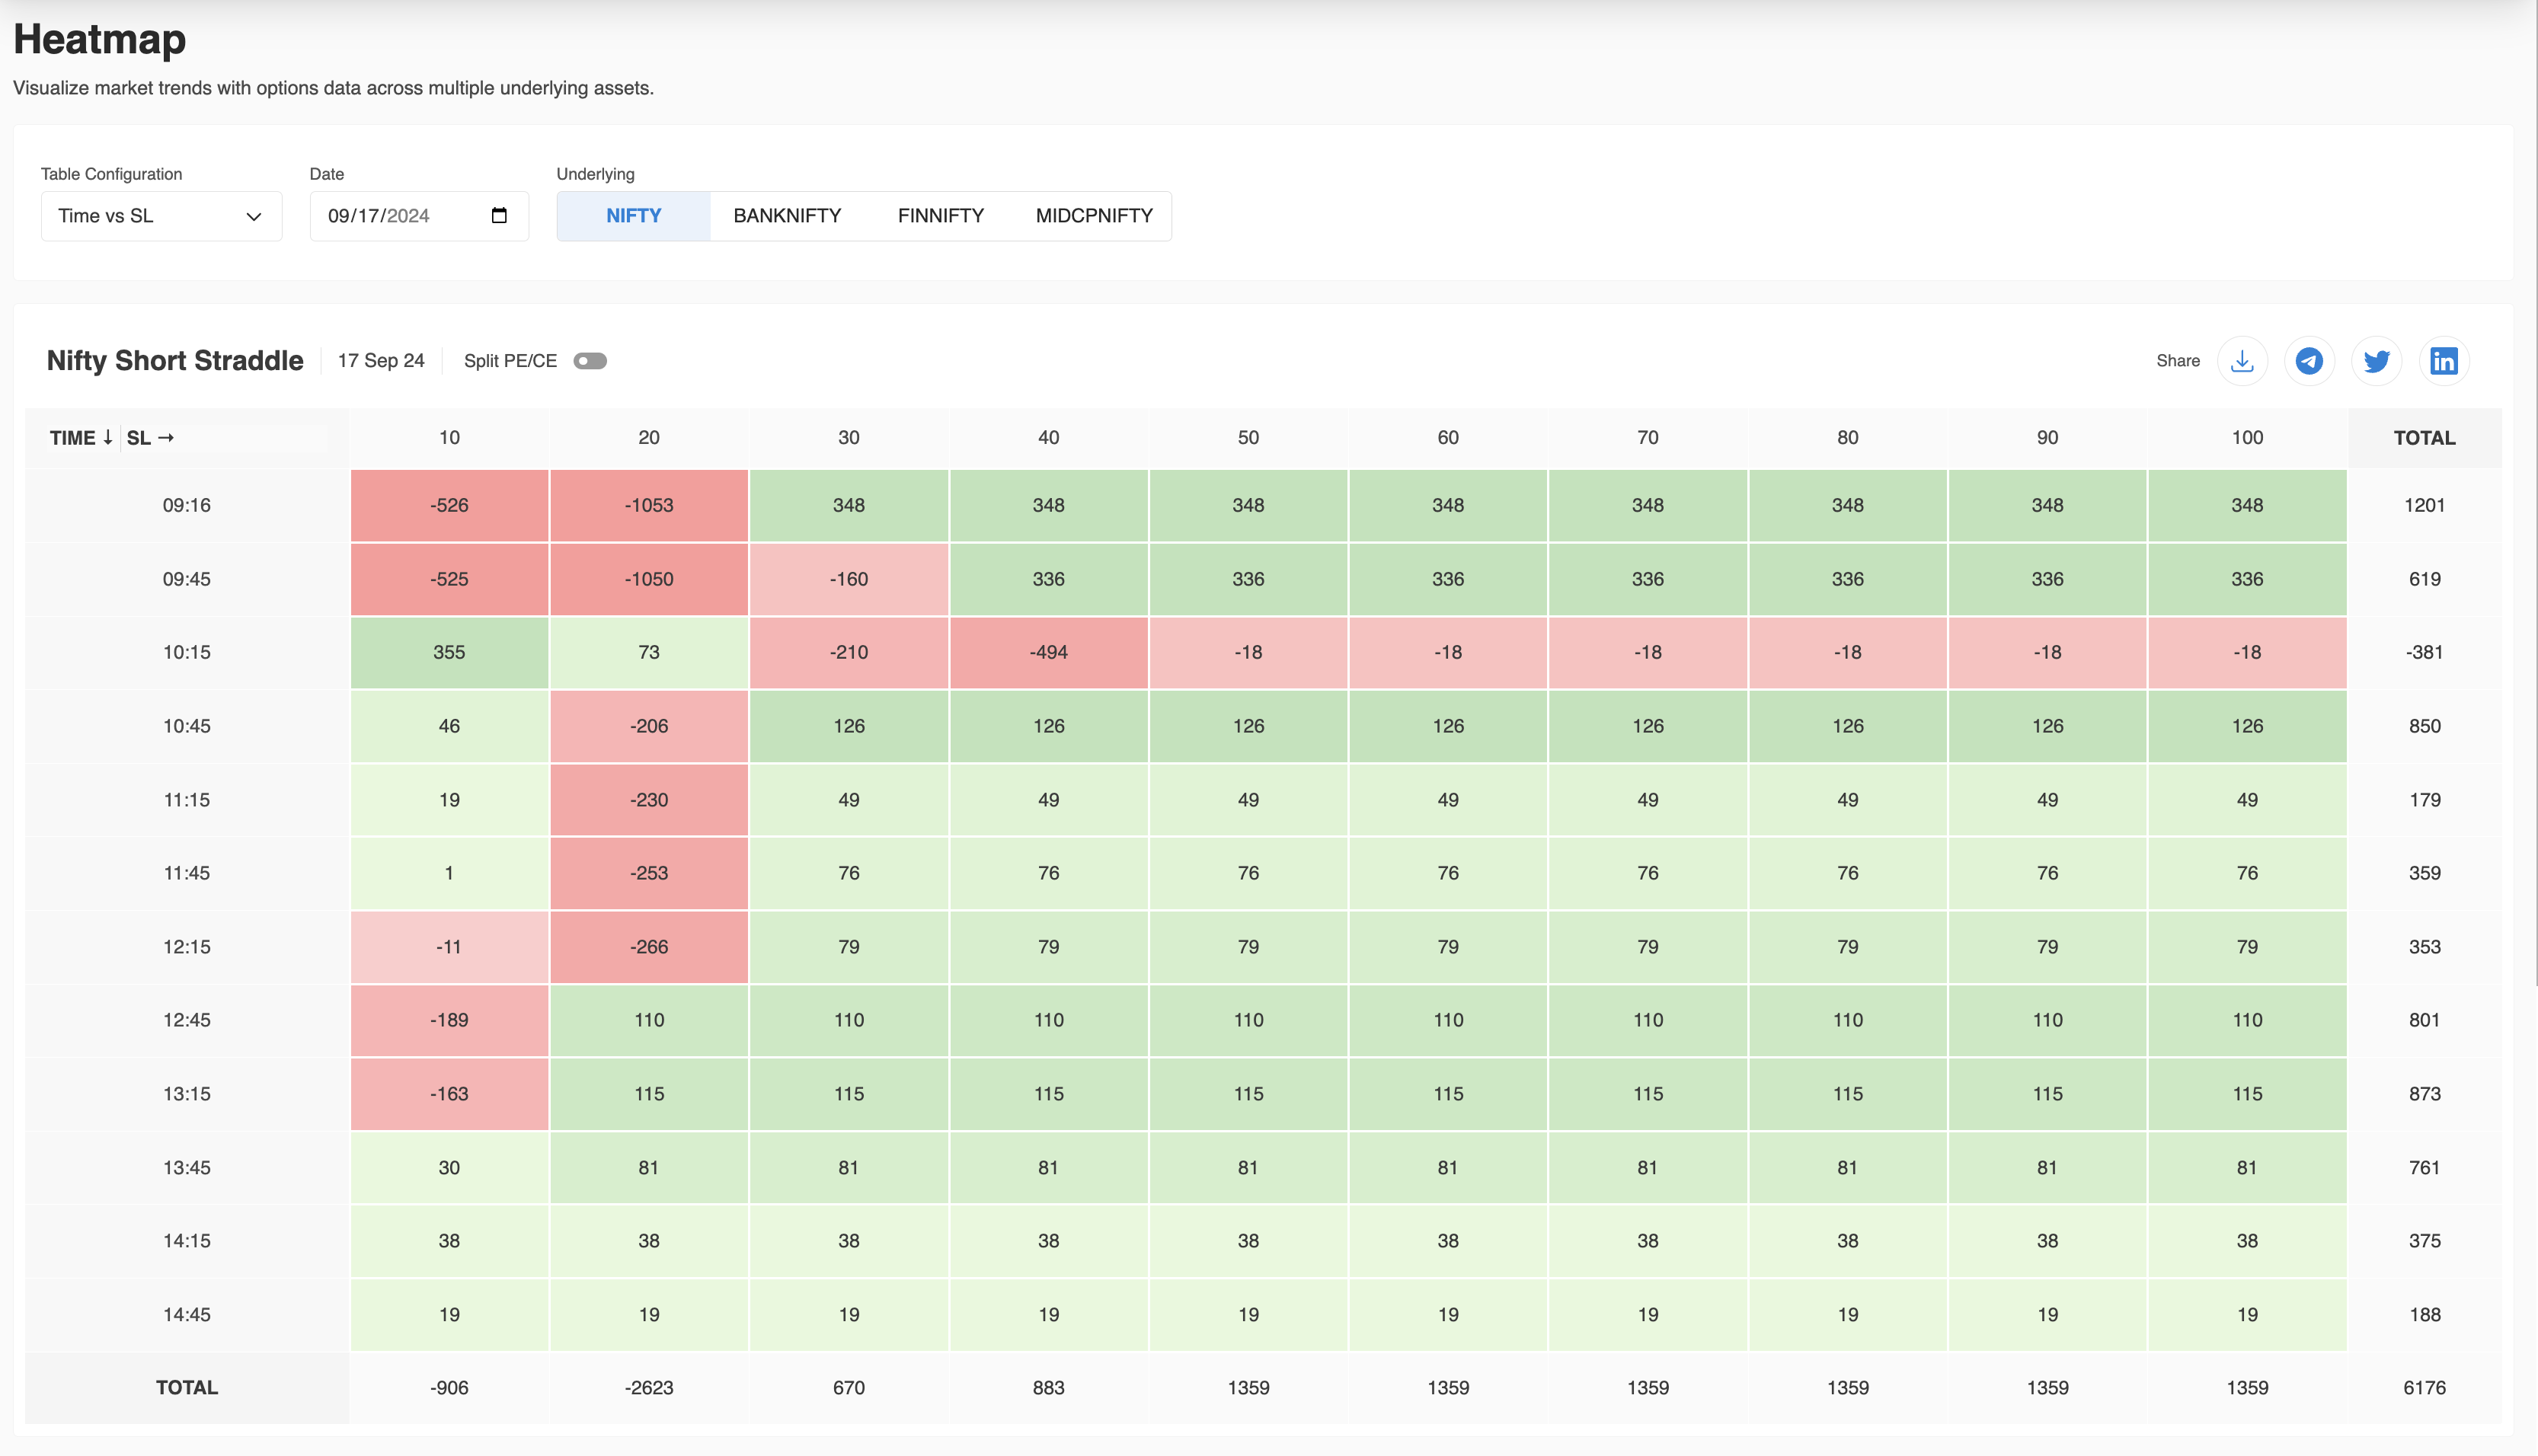
Time vs SL Mode
In Time vs SL mode:
Y-axis: Time intervals throughout the trading day.
X-axis: Various stop loss levels.
This mode is useful for tracking how different stop loss levels perform during different times of the day. For example, in one of the Nifty Short Straddle heatmaps, you can see the varying P&L across time and stop loss settings, colour-coded to indicate profit or loss (green for profit, red for loss).
Refer to Image 1 to see the Time vs SL mode in action, where we analyse the performance with split PE/CE data for better granularity.
Date vs Time Mode
In Date vs Time mode:
Y-axis: Time (in 30-minute intervals).
X-axis: Dates over your selected range.
This mode helps analyse how the Short Straddle strategy performs across different trading days. For instance, setting a 10% stop loss might show one performance trend, while changing it to a 40% stop loss, as seen in Image 2, can reveal different P&L outcomes.
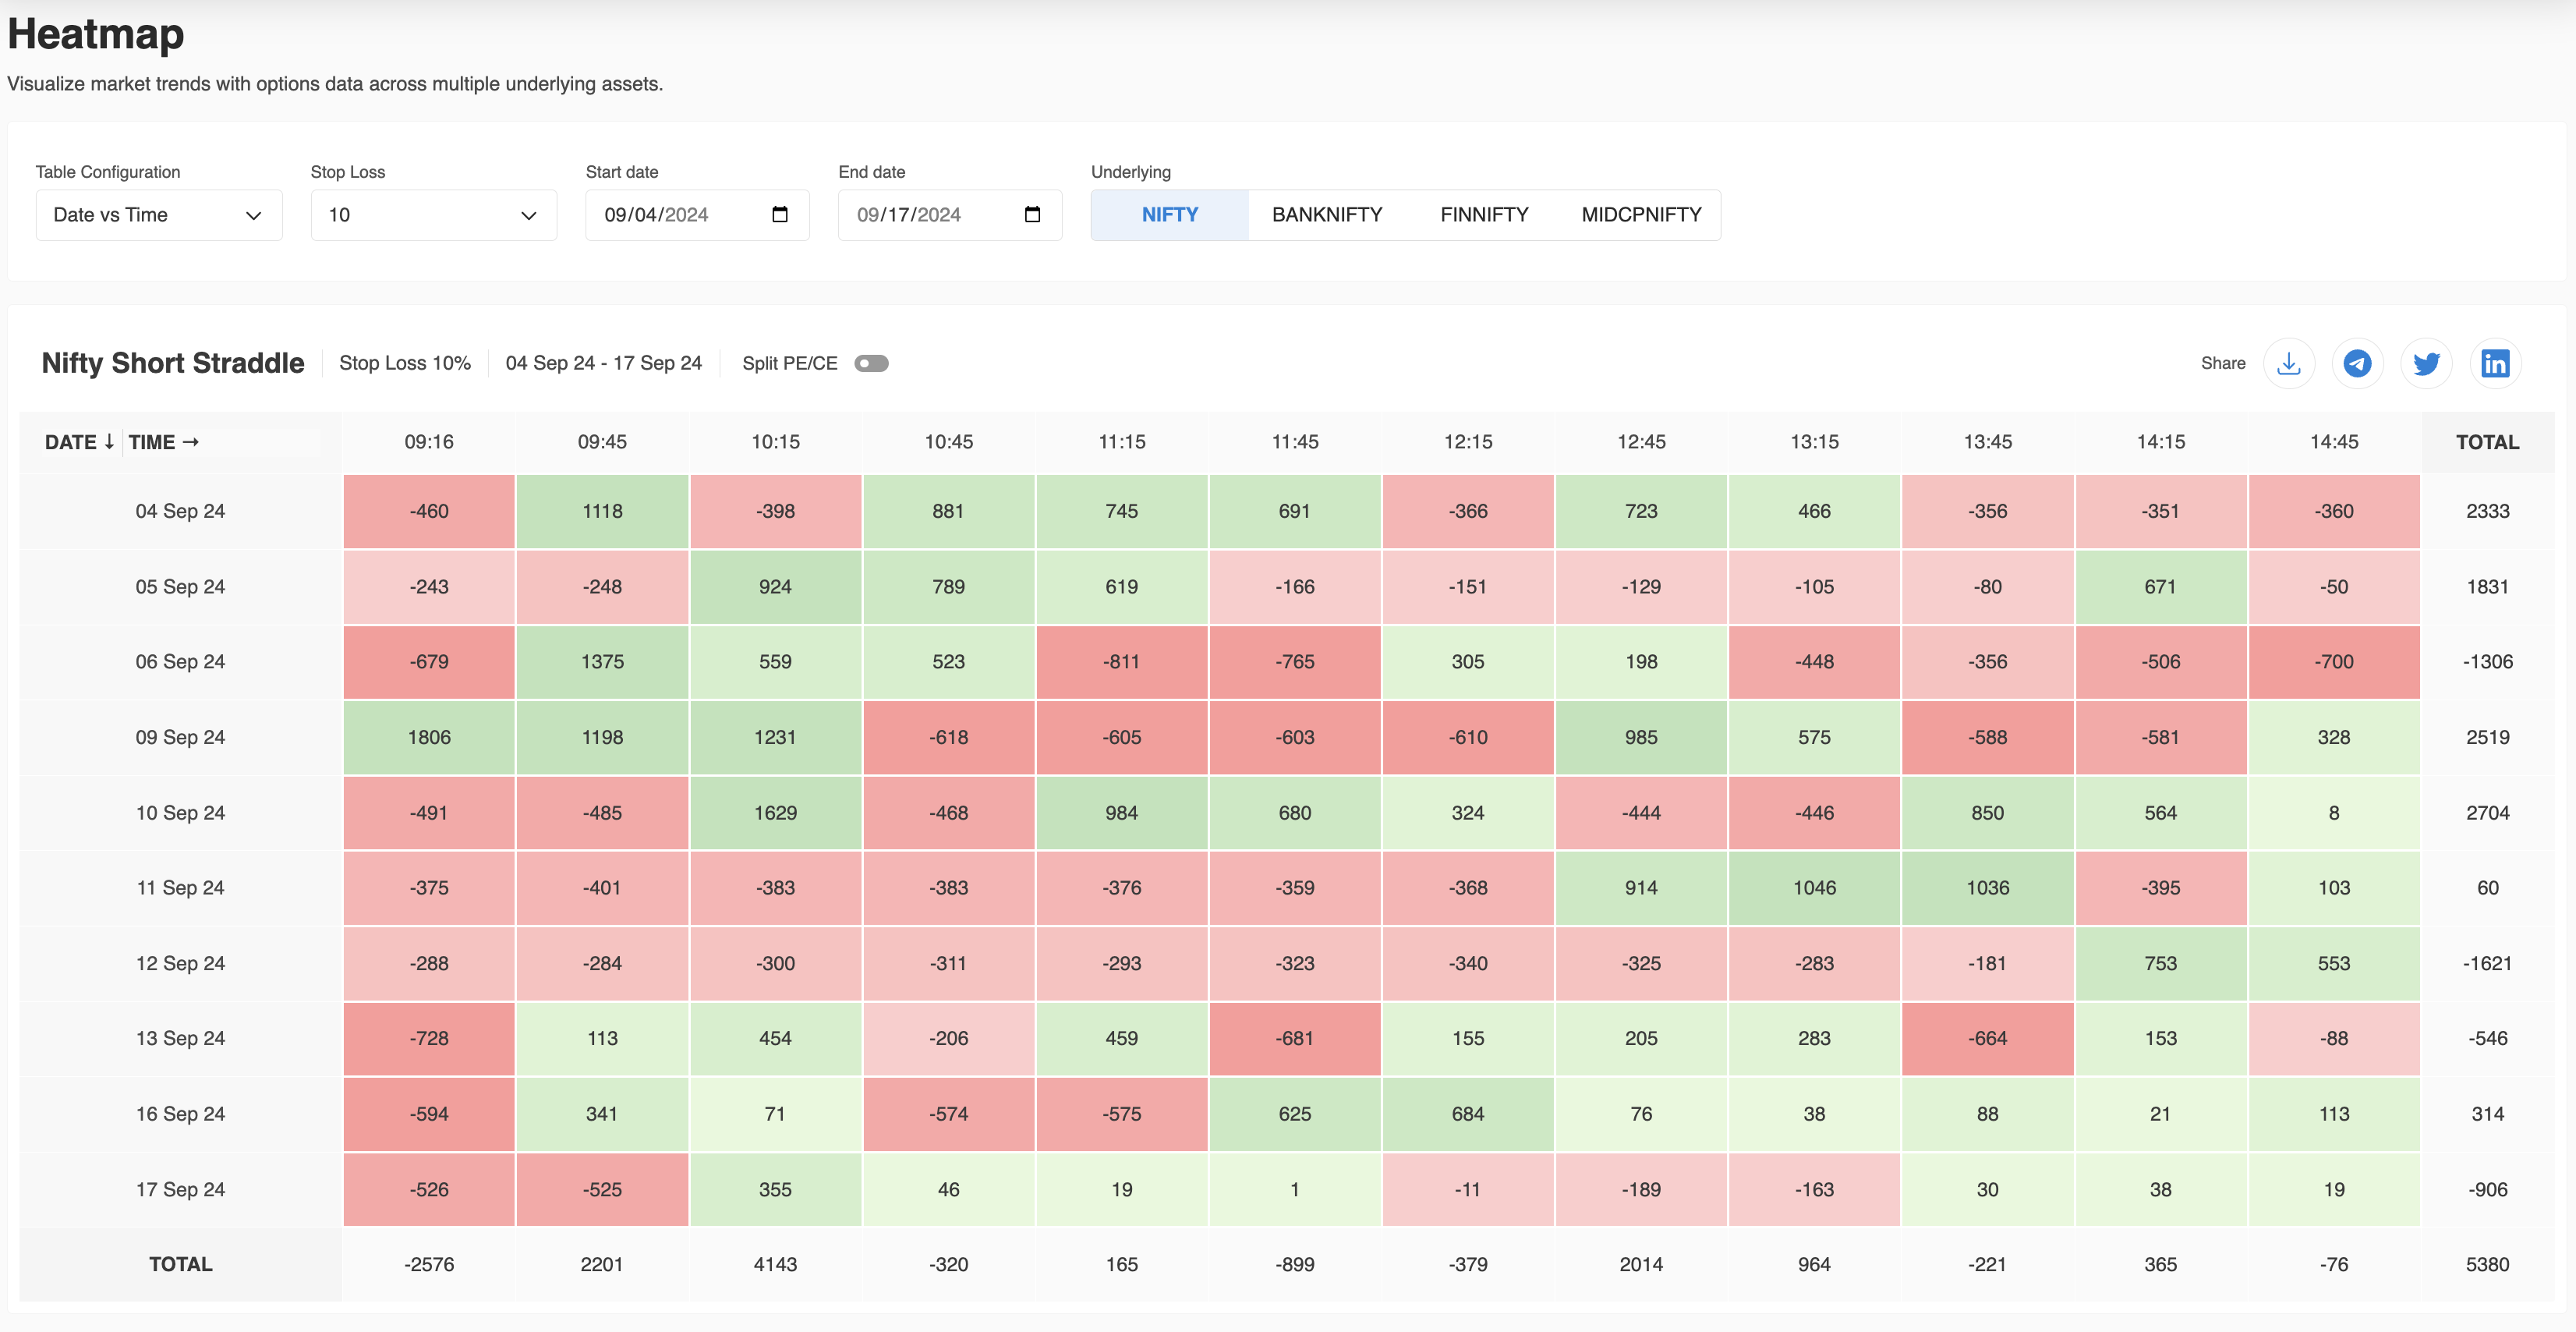
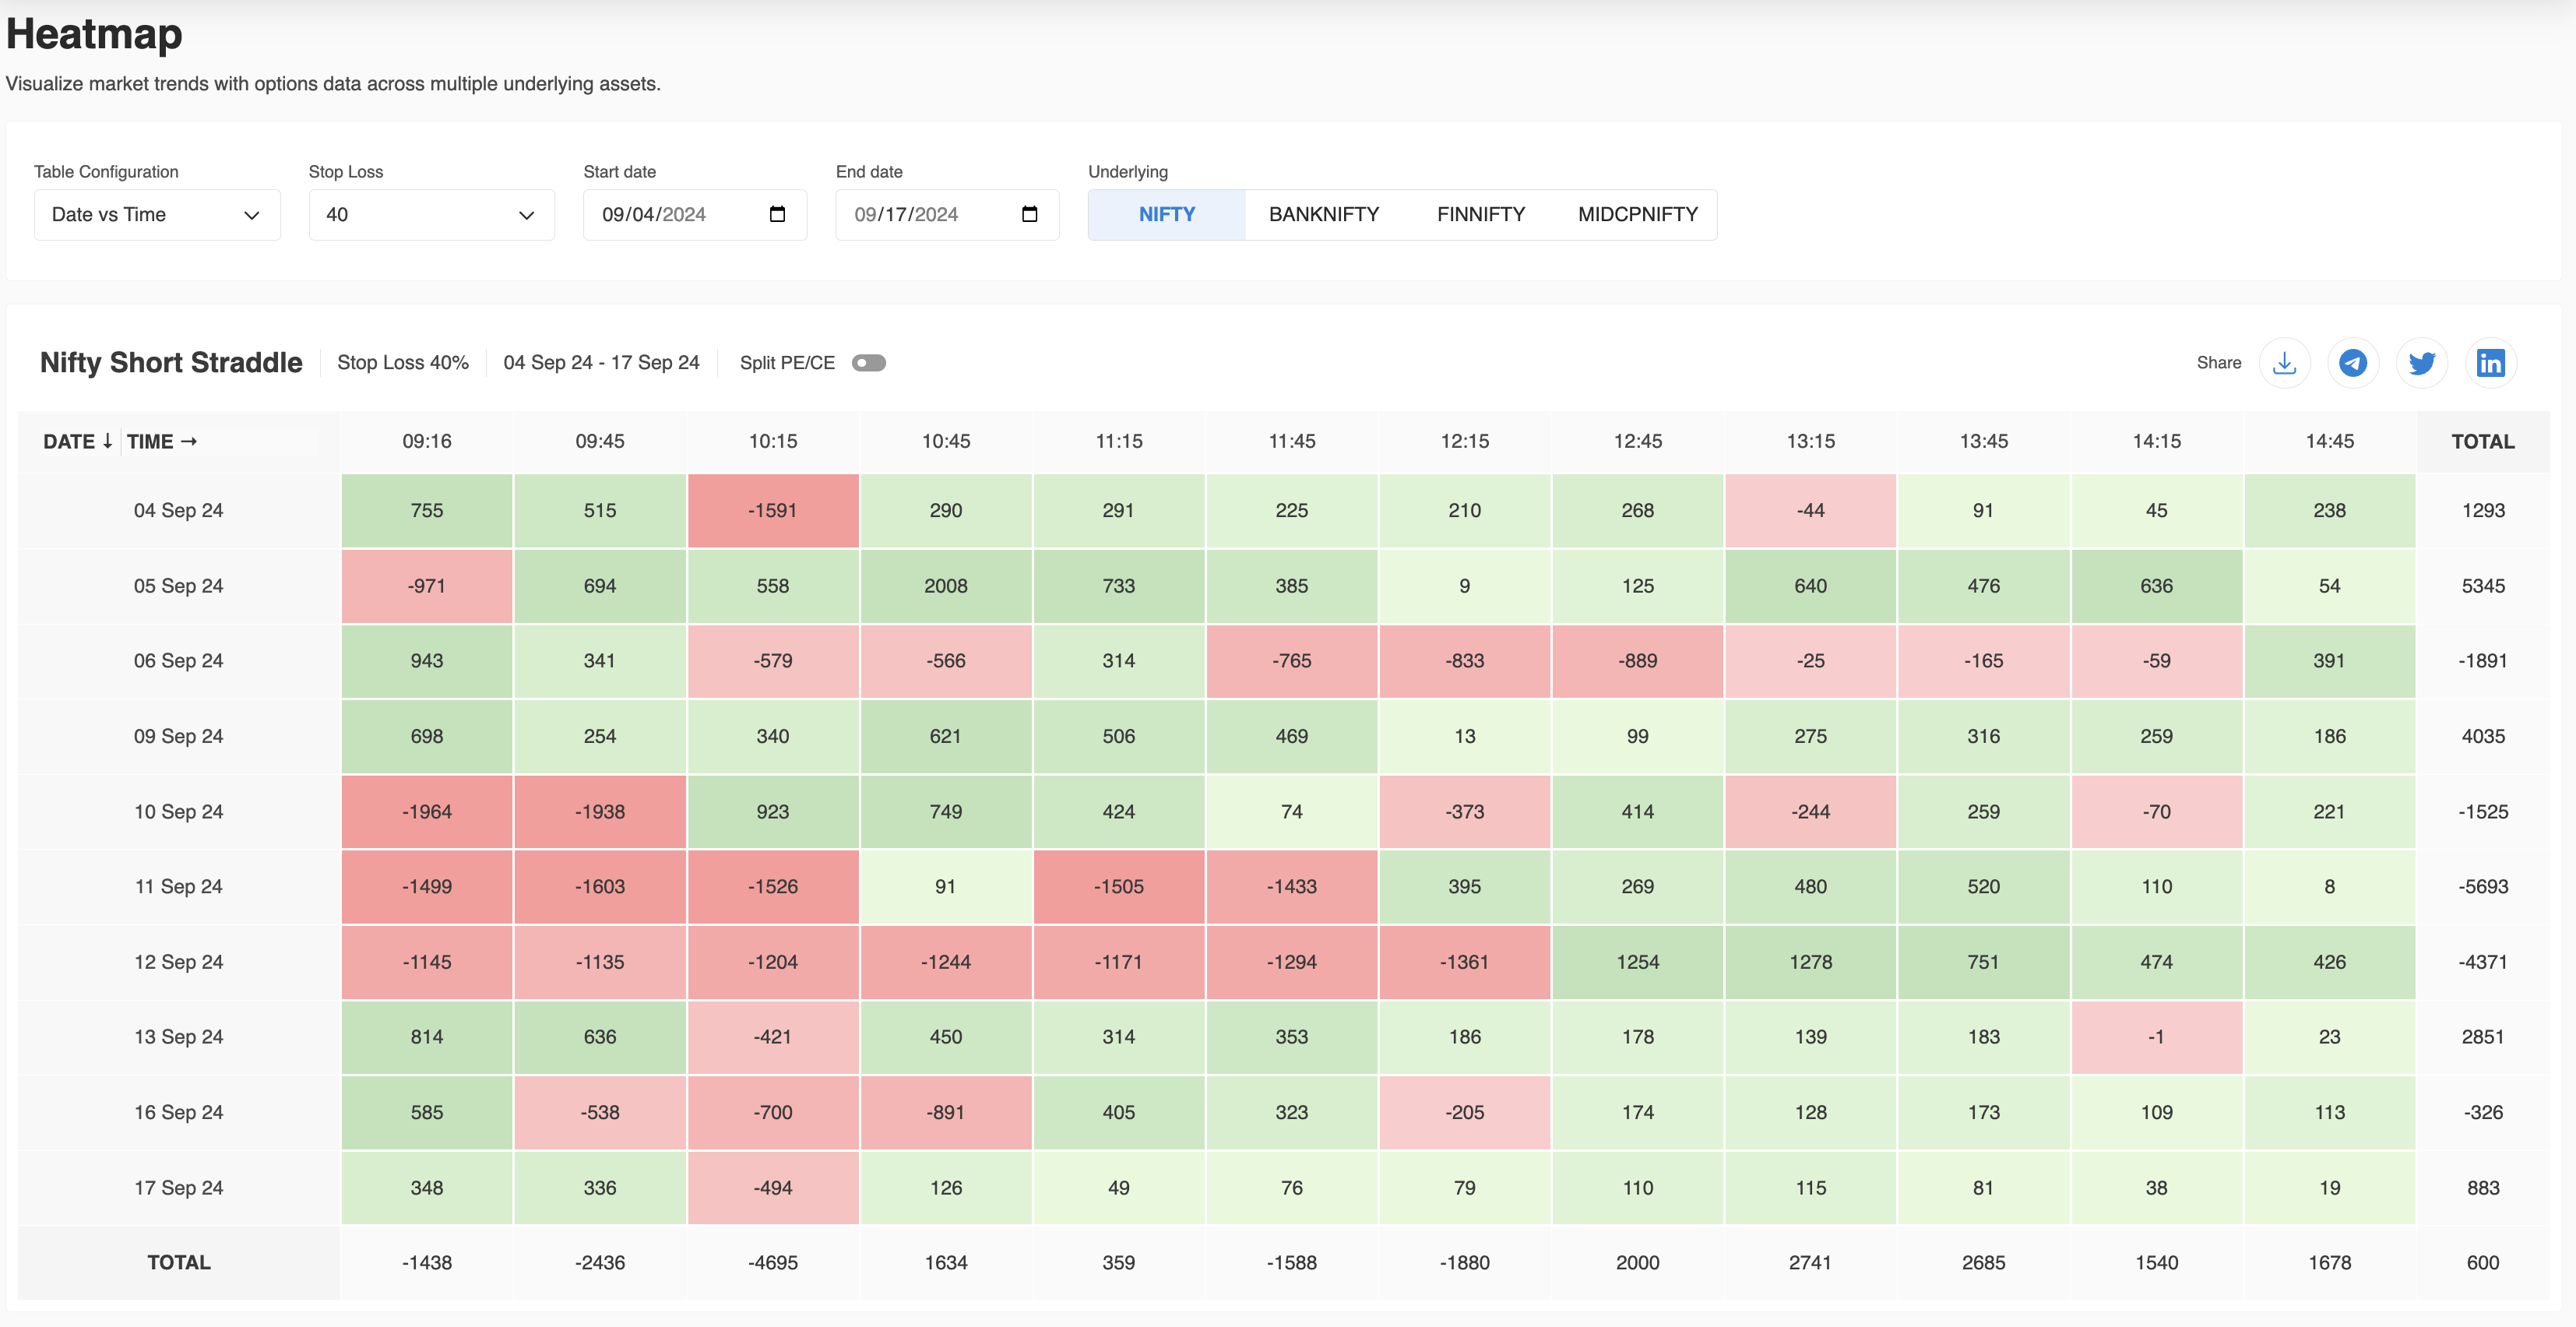
You can visualise and compare data from different dates and times, making it easier to identify profitable time slots or risk-heavy periods.
Date vs SL Mode
In Date vs SL mode:
Y-axis: Stop Loss levels.
X-axis: Dates of trading days.
This mode allows traders to observe how performance varies across different stop loss levels for each trading day. You can also adjust the specific time slots for more refined analysis. For example, in Image 4, the BankNifty Short Straddle heatmap shows the results across various stop loss levels.
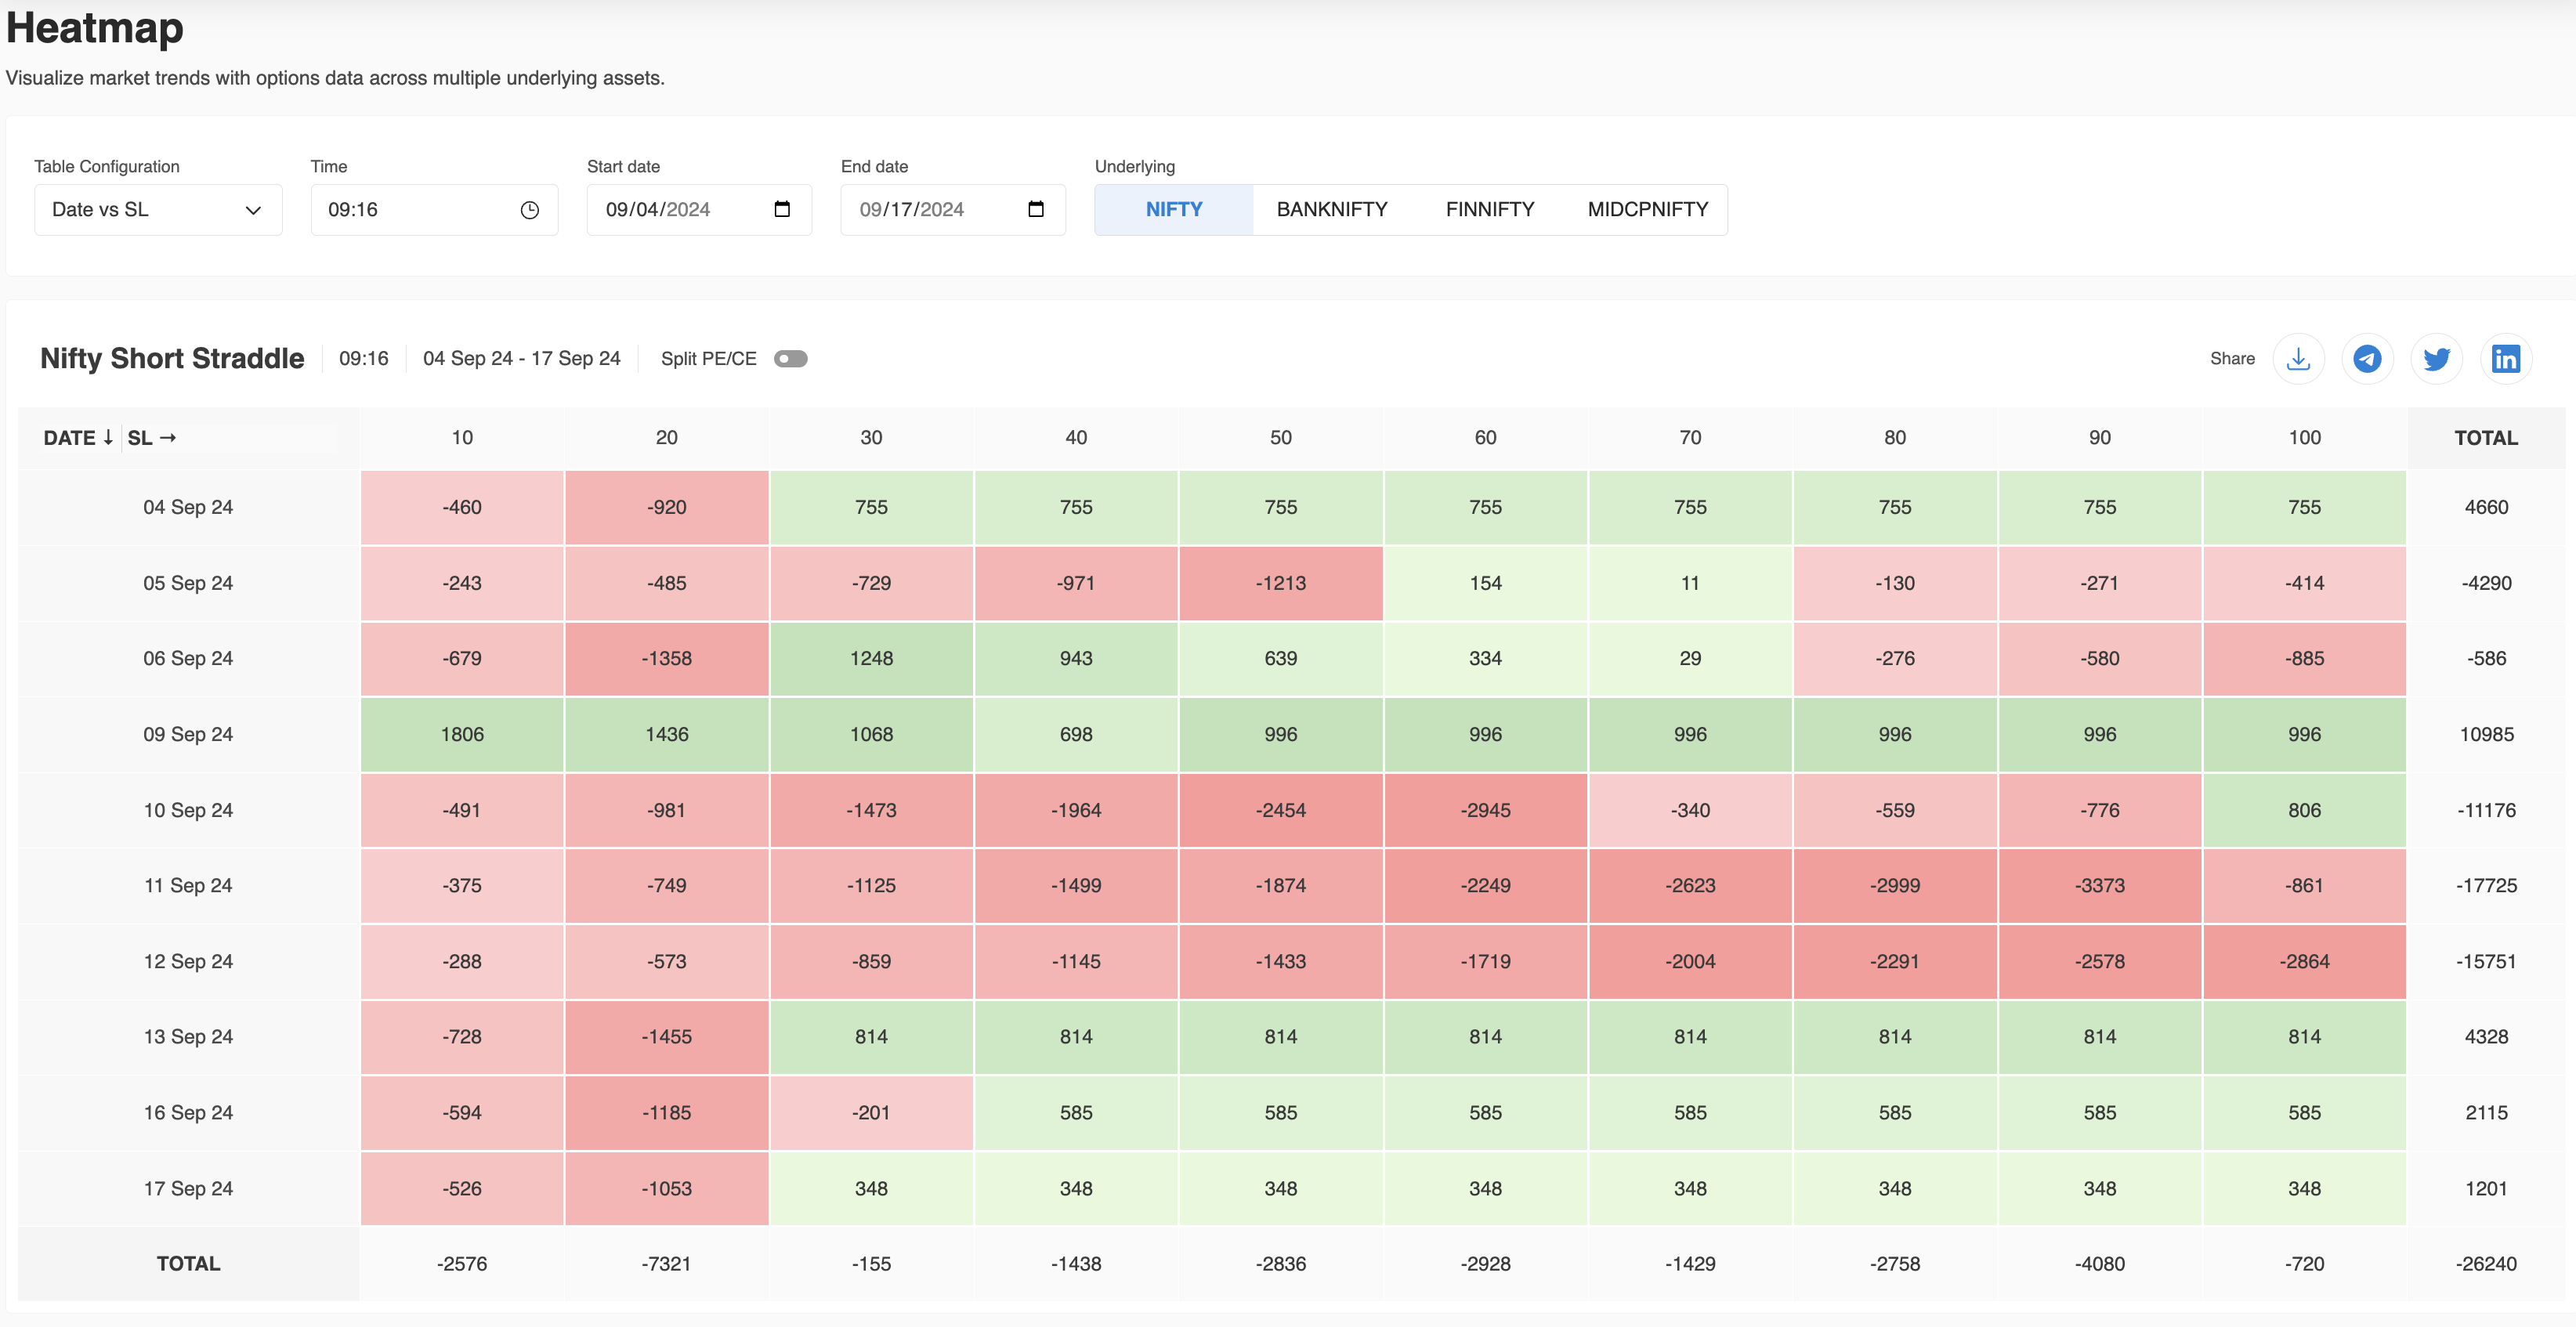
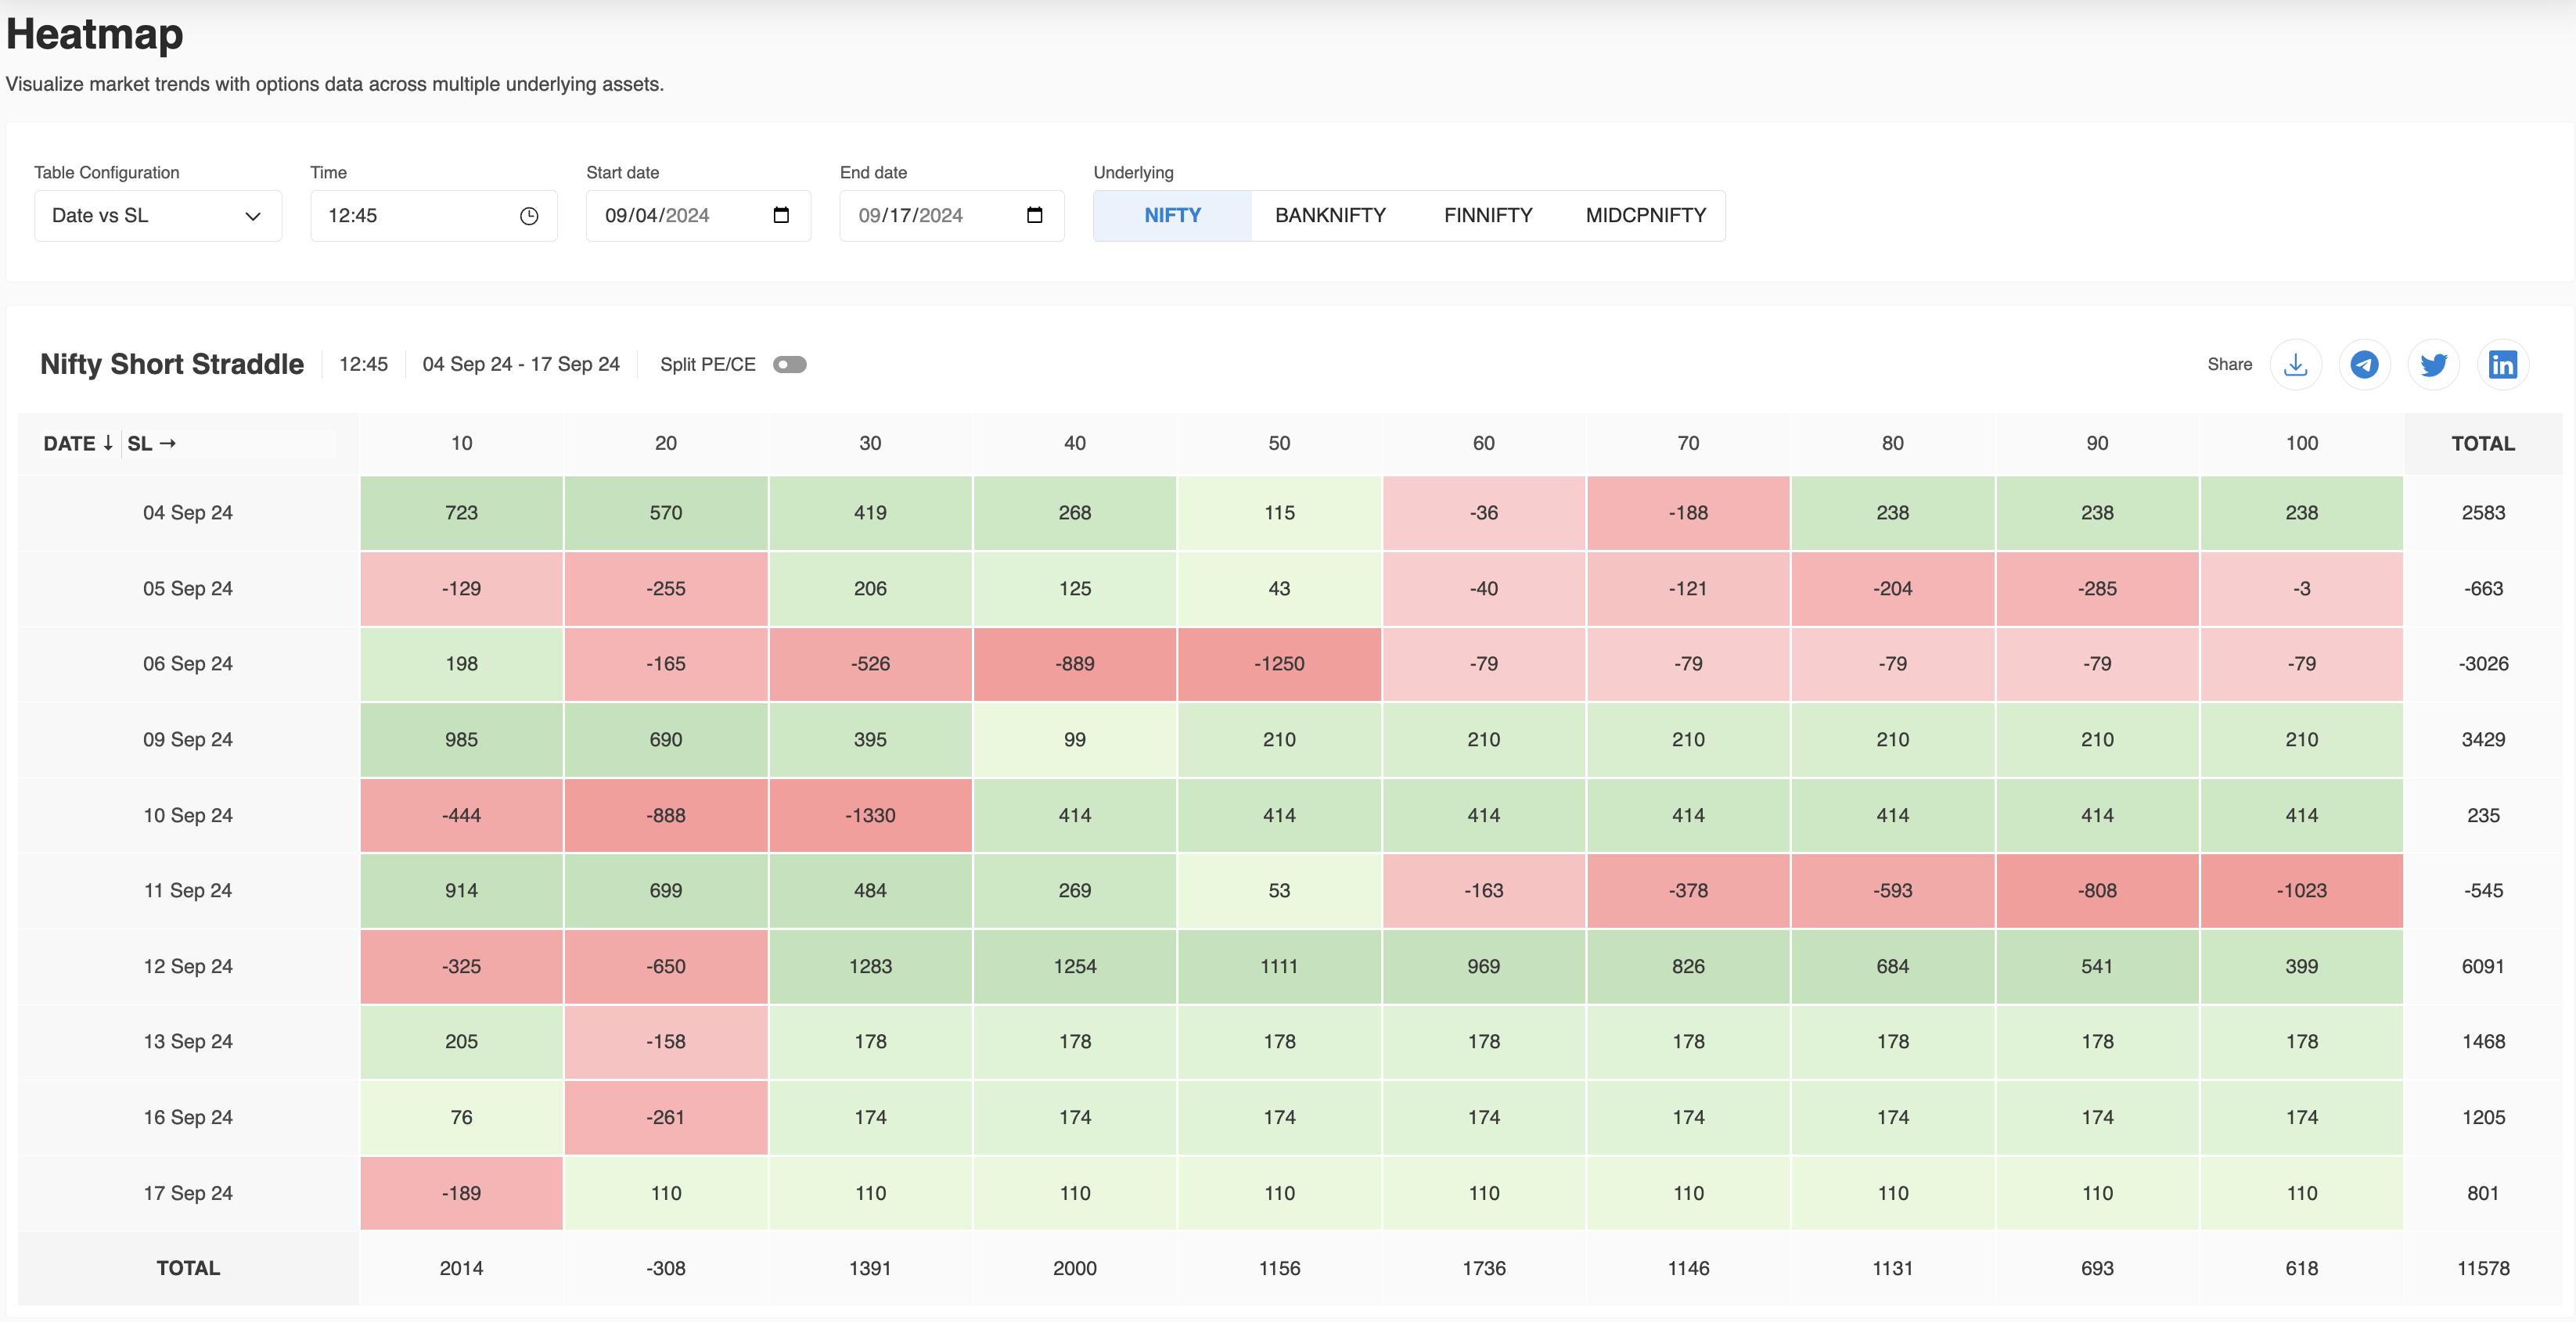
By setting the time to, say, 9:16 AM or 12:45 PM (as shown in Image 4), traders can get insights into how the strategy performs at different stop loss thresholds across the trading day.
Customization Options
Each of the above modes provides several customization options:
Time periods: Set specific time intervals (e.g., from 9:16 AM to 12:45 PM) for more granular insights.
Stop Loss levels: Adjust the stop loss level to match your risk tolerance and strategy.
Indices: Toggle between Nifty, BankNifty, FinNifty, and MidcapNifty for comparative analysis.
Conclusion
AlgoTest’s HeatMap feature is a powerful, easy-to-use tool for traders who want to optimise their Short Straddle strategies. With colour-coded P&L trends, flexible modes, and support for multiple indices, the HeatMap provides comprehensive insights into how your strategy performs over time.
Start exploring the HeatMap feature today and take control of your trading strategies!
Other Trader Friendly Products
:MTM Generator (Chrome and Firefox Extension)
:Free Straddle and Strangle Charts
:Margin Estimate for Options and Futures