Backtesting Terms
BackTesting Terms on AlgoTest
When you backtest on AlgoTest you will see the following terms appear in the search results. Please use this doc as a reference sheet to understand what the different terms mean.
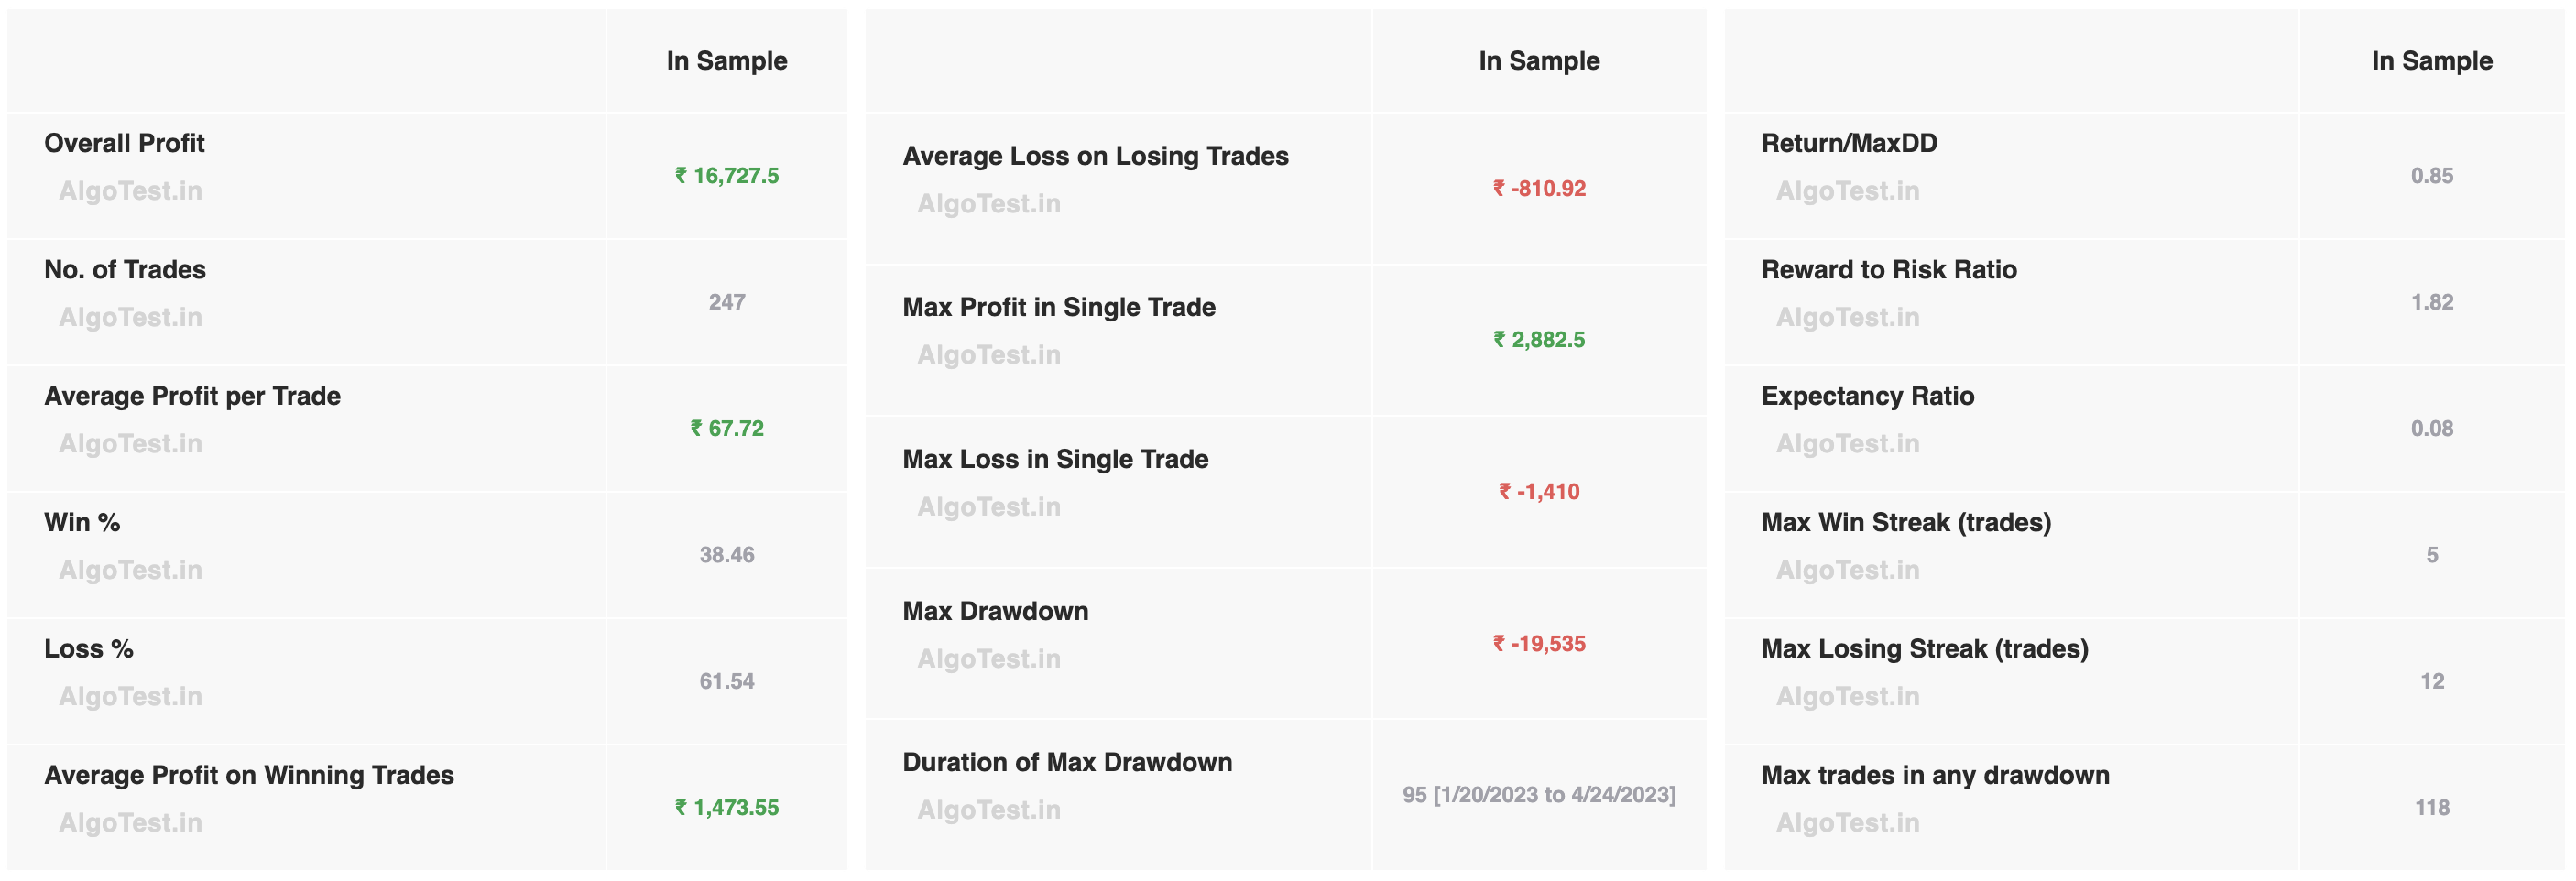
The image above is only for reference purposes.
Check out AlgoTest's very own Algo-Trading Course..
Preview for FREE!
Overall Profit
During the backtested period, the overall profit of a strategy indicates the total profit it earned. For instance, if a strategy was backtested for two years, the overall profit demonstrates the profit it generated for those two years.
Number of Trades
The metric "Number of Trades" represents the total number of days when your strategy executed trades. For instance, if you backtested a strategy for one week, which has five trading days, and your strategy traded on all five days, then the "Number of Trades" will be displayed as 5.
Average Profit Per Trade
The Average Profit Per Trade is a metric that indicates how much profit you can expect to make on each trade, on average. To calculate this metric, you can divide the overall profit by the total number of trades. For instance, if you have backtested a strategy and made a profit of 20000 in 20 trades, you can calculate the average profit as follows:
Average Profit = Overall Profit / Number of Trades
Average Profit = 20000 / 20
Average Profit = 1000
Win %
The term "Win %" refers to the percentage of times you have made a profit when trading. For example, if you have traded 100 times and made a profit on 70 of those trades while incurring a loss on the remaining 30, your win % will be 70. In another instance, if you have backtested a trading strategy and found that you executed a total of 200 trades, out of which you made a profit on 150 trades and incurred a loss on 50, then your win % would be calculated as follows:
Win % = (150/200) * 100
Win % = 0.75 * 100
Win % = 75%
Loss %
The term "Loss %" refers to the percentage of times you have made a loss when trading. For example, if your trading strategy consisted of 100 trades, out of which you made a profit 70 times and incurred a loss 30 times, then your loss % would be 30.
To illustrate another example, suppose you backtested a strategy and found that you made a total of 200 trades, out of which you made a profit 150 times and incurred a loss 50 times. In this case, your win % would be calculated as follows:
Win % = (50/200) * 100
Win % = 0.25 * 100
Win % = 25%
Average Profit on Winning Trades
The term "Avg. Profit on Winning Trades" refers to the average profit that a strategy has made on its profitable trades. To understand this better, let's take an example where you have backtested a strategy and obtained the following results:
Total Number of Trades = 100
Number of Profitable Trades = 40
Profit made on 40 Profitable Trades = 4000
To calculate the average profit on winning trades, you need to divide the total profit made on profitable trades by the number of profitable trades. In this case, the calculation would be as follows:
Avg. Profit on Winning Trades = Profit made on profitable trades / Number of profitable trades
Avg. Profit on Winning Trades = 4000 / 40
Avg. Profit on Winning Trades = 100
Therefore, the average profit on winning trades for this particular strategy is 100.
Average Loss on Losing Trades
The term "Avg. Profit on Winning Trades" refers to the average loss a trading strategy has incurred on its losing trades. For example, if you backtested a strategy and found that out of 100 trades, 60 were losing trades and you made a loss of 6000 on the remaining 60 losing trades, then you can calculate the average loss on losing trades as follows:
Avg. Loss on Losing Trades = Overall Loss on losing trades/Number of losing trades
Avg. Loss on Losing Trades = 6000 / 60
Avg. Loss on Losing Trades = 100
In this case, the average profit on losing trades would be 100.
Max Profit in a Single Trade
The term "Max Profit in a Single Trade" refers to the highest amount of profit made by a strategy in a single trade. For example, if you have created and backtested a strategy from 01/01/2022 to 05/01/2022, and the results are as follows:
| Date | Profit/Loss Amount |
|---|---|
| 01/01/2022 | 500 profit |
| 02/01/2022 | 800 profit |
| 03/01/2022 | 700 loss |
| 04/01/2022 | 600 profit |
| 05/01/2022 | 200 loss |
Then, the max profit in a single trade would be +800.
Max Loss in a Single Trade
The term "Max Loss in a Single Trade" refers to the maximum loss that a trading strategy has experienced in a single trade.
For instance, if you have developed and tested a trading strategy from January 1, 2022, to January 5, 2022, and the results are as follows:
| Date | Profit/Loss Amount |
|---|---|
| 01/01/2022 | 500 profit |
| 02/01/2022 | 800 profit |
| 03/01/2022 | 700 loss |
| 04/01/2022 | 600 profit |
| 05/01/2022 | 200 loss |
Then the maximum loss that the strategy has experienced in a single trade is 700.
Max Drawdown
A maximum drawdown (MDD) refers to the highest observed loss from the highest point to the lowest point of a portfolio, before a new peak is reached. This is an important metric that indicates the potential downside risk over a specific time period.
For instance, if you have backtested a strategy from January 1st, 2022 to January 9th, 2022, the maximum drawdown will give you a clear idea of how much loss you can expect during that time period.
| Date | Profit/Loss | Overall Strategy Profit/Loss |
|---|---|---|
| 01/01/2022 | 1000 | 1000 |
| 02/01/2022 | -2000 | -1000 |
| 03/01/2022 | -1500 | -2500 |
| 04/01/2022 | 4000 | 1500 |
| 05/01/2022 | -5700 | -4200 |
| 08/01/2022 | -1300 | -5500 |
| 09/01/2022 | 4000 | -1500 |
| 10/01/2022 | 800 | -700 |
In the table above, you can see that between January 1st, 2022 and January 4th, 2022, your overall strategy portfolio initially peaked at 1000 before dropping to -2500, before eventually reaching a new peak of 1500 on January 4th, 2022. This means that the maximum drawdown during this period was 3500, which refers to the difference between the peak profit of 1000 and the lowest point of loss at -2500.
Following this, between January 4th, 2022 and January 10th, 2022, your overall strategy portfolio peaked again at 1500 before dropping to -5500, before reaching a new peak of 2300 on January 10th, 2022. This resulted in a maximum drawdown of 7000, which refers to the difference between the peak profit of 1500 and the lowest point of loss at -5500.
Therefore, you experienced 2 drawdowns during this period, with the first being 3500 and the second being 7000. However, the maximum drawdown throughout the entire period from January 1st, 2022 to January 10th, 2022 was 7000.
Duration of Max Drawdown
The term 'max drawdown duration' refers to the length of time during which your investment strategy or portfolio has experienced the greatest decline in value.
| Date | Profit/Loss | Overall Strategy Profit/Loss |
|---|---|---|
| 01/01/2022 | 1000 | 1000 |
| 02/01/2022 | -2000 | -1000 |
| 03/01/2022 | -1500 | -2500 |
| 04/01/2022 | 4000 | 1500 |
| 05/01/2022 | -5700 | -4200 |
| 08/01/2022 | -1300 | -5500 |
| 09/01/2022 | 7000 | 1500 |
| 10/01/2022 | 800 | 2300 |
Two drawdowns were faced by the strategy in the table: the first was 3,500 and the second was 7,000. The maximum drawdown of 7,000 occurred over four days, from May 5, 2022 to May 8, 2022, within the period of May 1 to May 10.
Reward to Risk Ratio
This displays the potential reward as compared to the potential risk of the strategy.
In simpler terms, it shows you how much reward you can earn for every rupee of risk taken. A higher ratio indicates that the strategy has the potential for bigger profits compared to the risk involved.
| Trades | Profit/Loss |
|---|---|
| 01/01/2023 | -400 |
| 02/01/2023 | 900 |
| 03/01/2023 | 1100 |
| 04/01/2023 | -600 |
Reward to Risk Ratio = Total Profit on profitable days/Total Loss on losing days
Reward to Risk Ratio = 1100+900/600+400
Reward to Risk Ratio = 2000/1000
Reward to Risk Ratio = 2
Return/Max DD
During the backtest period, return over max drawdown is calculated by dividing the overall profit by the maximum drawdown in the backtest period, and then dividing that by the number of years in the backtest period. The higher the value, the better.

As shown in the image above, the overall profit in 2019 was 51006 with a maximum drawdown of 7864. The returns to maximum drawdown ratio can be calculated as follows:
Returns/Max Drawdown = 51006/7864, which results in 6.48.
Expectancy Ratio
What is the Expectancy Ratio?
The Expectancy Ratio is a key metric that helps traders understand what they can expect to gain or lose for every unit of risk taken in their trading strategies. It provides insight into the overall effectiveness of a trading system, similar to how casinos rely on favorable odds to ensure profitability over time.
Expectancy combines the probability of winning and losing with the average profit and loss per trade. It’s calculated using the formula:
Expectancy = (Probability of Win × Average Win) - (Probability of Loss × Average Loss)
For example, if a trader’s strategy wins 40% of the time with an average profit of 20%, and loses 60% of the time with an average loss of 5%, the expectancy would be:
Expectancy = (0.4 × ₹3,125) - (0.6 × ₹625) = ₹625 per trade
This means even though the strategy loses more often than it wins, the average profit per trade remains positive, demonstrating the system’s profitability over time.
Understanding the Impact
A positive expectancy suggests that, over multiple trades, the strategy is likely to be profitable. For instance, if a trader executes 65 trades in a year with an expectancy of ₹625 per trade, the expected annual gain would be ₹40,625, translating to a 40% return on a ₹1,00,000 portfolio.
Why Expectancy Matters
Expectancy is crucial because it highlights that the frequency of winning trades isn’t as important as the size of the wins relative to losses. A system can still be profitable even if it wins less often than it loses, as long as the wins are significantly larger than the losses.
Max Win Streak
The term 'Max Win Streak' refers to the maximum count of consecutive profitable trades, without any intervening losing trades.
Max Losing Streak
The term 'Max Losing Streak' refers to the maximum count of consecutive trades that resulted in losses, without any winning trades in between them.
Max Trades in Any Drawdown
It refers to the Maximum number of days when your strategy was in a drawdown phase. This drawdown phase need not be equal to your max drawdown(monetarily).
For instance, if you backtested a strategy and the results are as shown in the table below:
| Drawdown | Loss | Number of Trading Days |
|---|---|---|
| Drawdown 1 | 5000 | 15 |
| Drawdown 2 | 7000 | 10 |
In the table above, you can see that there were 2 instances of drawdown in the strategy. The first drawdown had 15 trades, while the second had 10 trades. Although the second drawdown was bigger, the number of trading days in the first drawdown was more. Therefore, the maximum number of trades in any drawdown in this case is 15.
Slippage
Slippage refers to the difference between the price at which you intend to place an order and the actual price at which it gets executed.
When you trade in a live market, it is not guaranteed that you will always get the same price at which you placed the order. This is because of factors such as volatility, bid-ask spread, and others.
:You can click here to learn more about this.
For instance, if you placed an order to buy a stock at 100, but it got executed at 101 or 99, the difference between the intended price and the executed price is known as slippage. If the order gets executed at 99, it means that you experienced positive slippage. However, if it is executed at 101, then it is negative slippage.
To get a more accurate prediction, it is essential to factor in slippage when analyzing the results of your backtest.