Free Charts - Straddle | Strangle
Charts on AlgoTest
Are you tired of struggling to find a platform that provides straddle, strangle, or multi-leg option charts? Ever wanted to trade while looking at these charts but didn't know where to find them?
Look no further because AlgoTest has you covered!
Introducing AlgoTest Charts, a fantastic feature that allows you to access straddles, strangles, and multi-leg option charts for free.
With AlgoTest Charts, you have everything you need for successful trading in one place. From analysing your trades to enhancing your trading skills and making informed decisions, AlgoTest has got you covered.
What's even better about AlgoTest Charts is that you can supercharge your trading with advanced charting tools and indicators for straddles, strangles, and multi-leg options. Say hello to a whole new level of trading confidence and success with AlgoTest Charts!
How to use Charts on AlgoTest
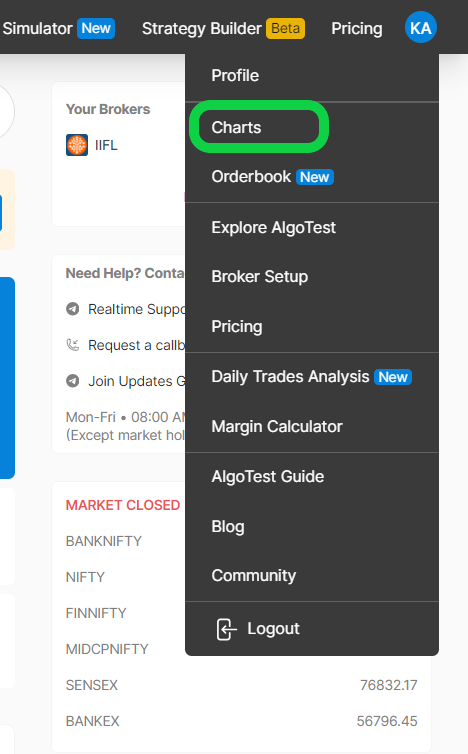
Visit AlgoTest and log in to your account. Then click on the profile icon, as shown in the image below.

Now, click on the charts button to view charts in AlgoTest.
You will be able to view option ATM straddle charts, as shown in the image below.
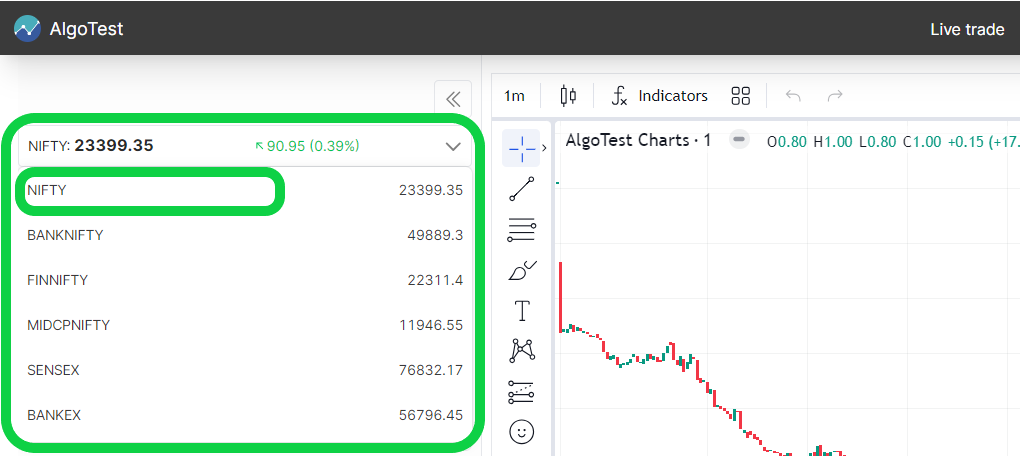
Selecting Instrument
You can select the instrument from the drop-down menu, as shown in the image below. For example, if you want to view the option charts for Nifty, you will select "Nifty" here.
If you want to see the underlying spot line chart along with option charts, you can enable the Show Underlying feature. This will display the underlying line chart along with the option charts.
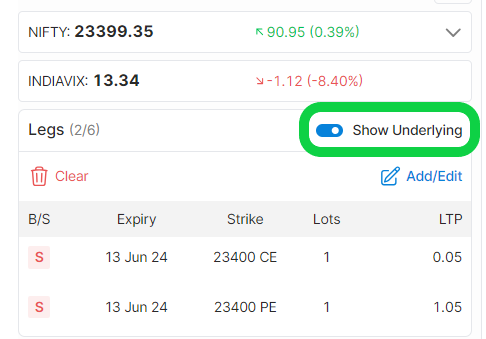
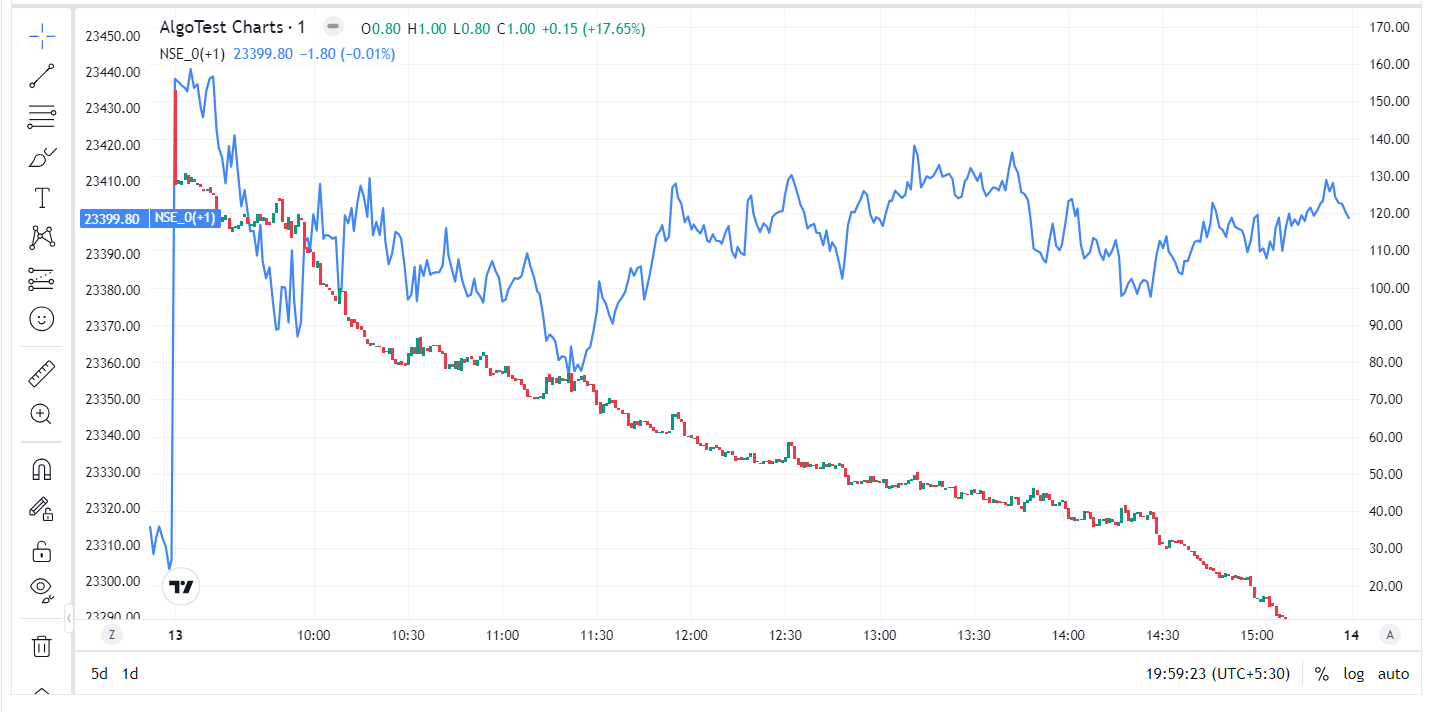
The blue line chart represents the underlying line chart as shown in the image below.
Legs (Select Option Strikes)
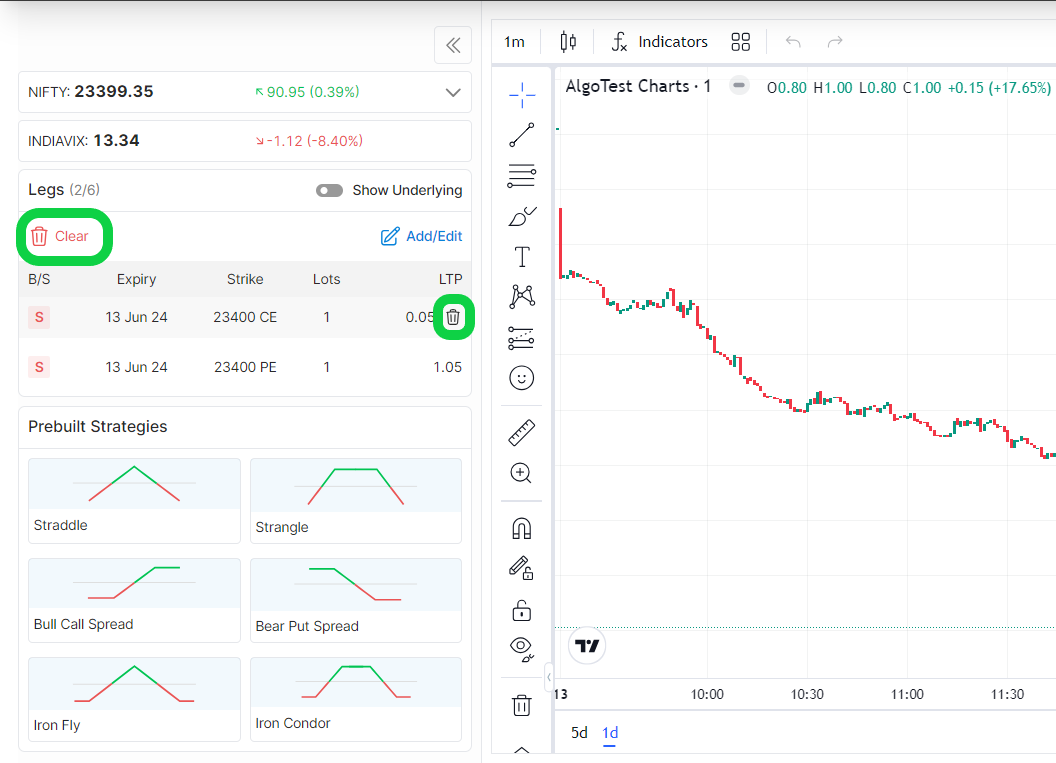
In the "Legs" section, you can add or delete future/option legs. By default, you will be able to view an ATM CE and PE legs added there. You can delete them by clicking on the delete or clear button as shown in the image below.
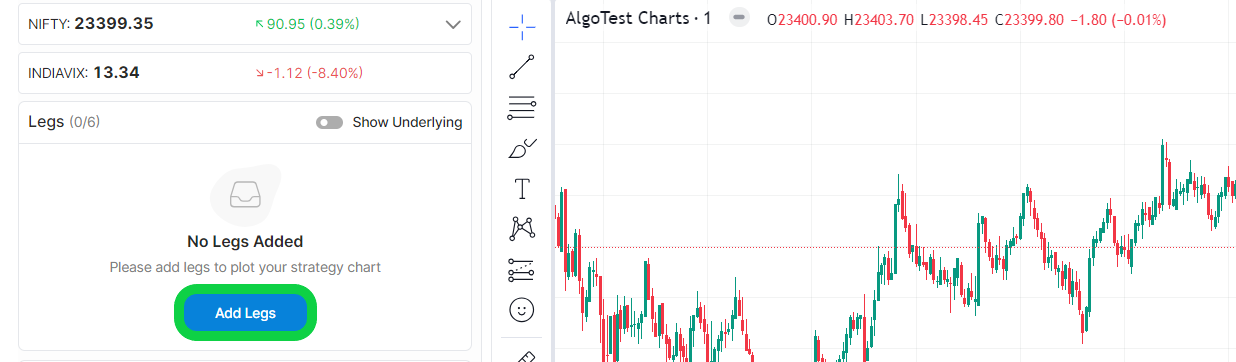
Now to add an option chart, add a leg by clicking on the "add leg" button and select the leg or legs from the option chain that you want to add, then view the chart.
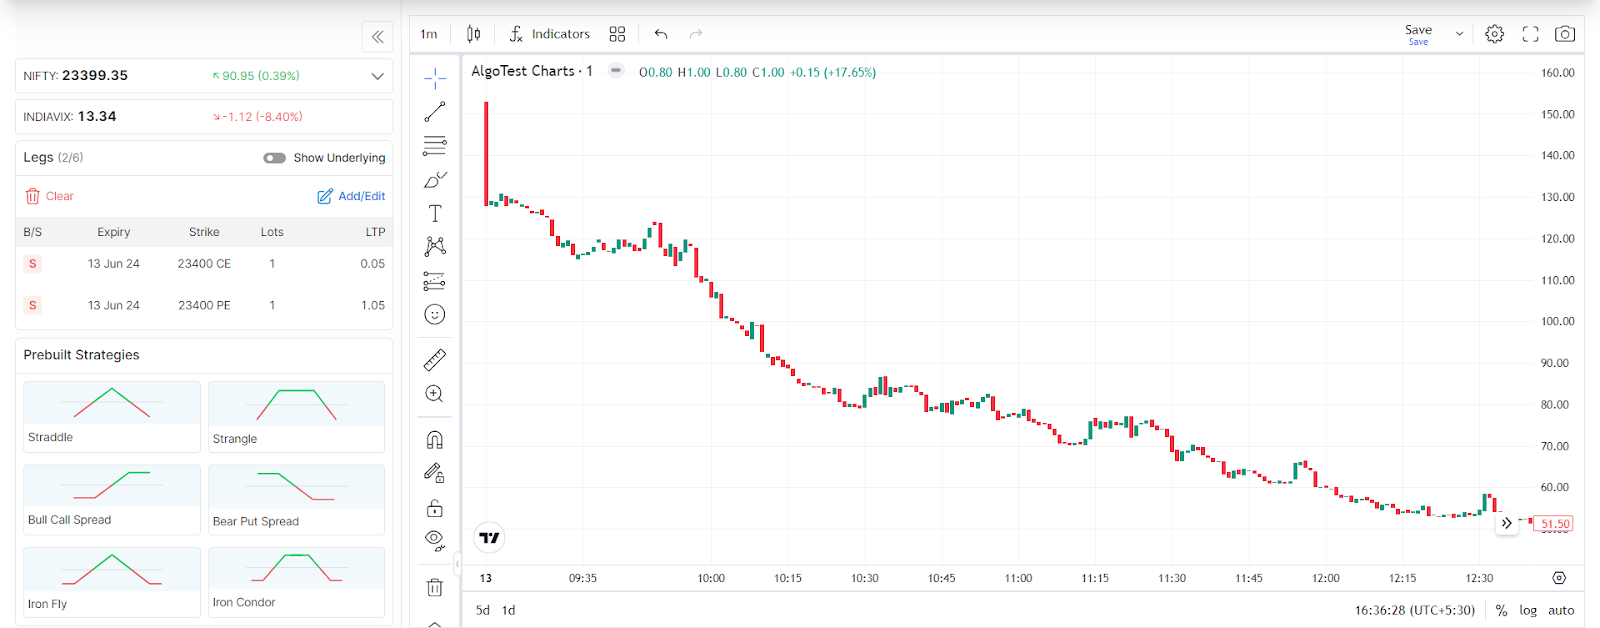
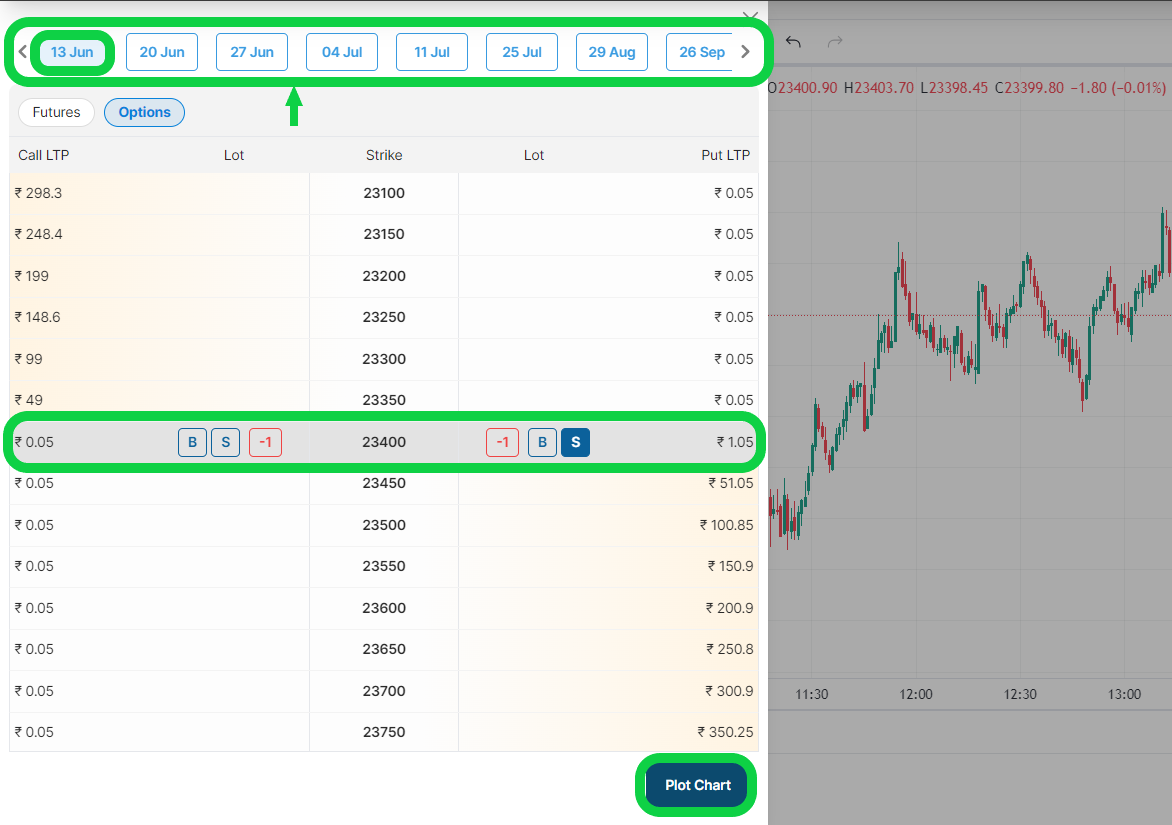
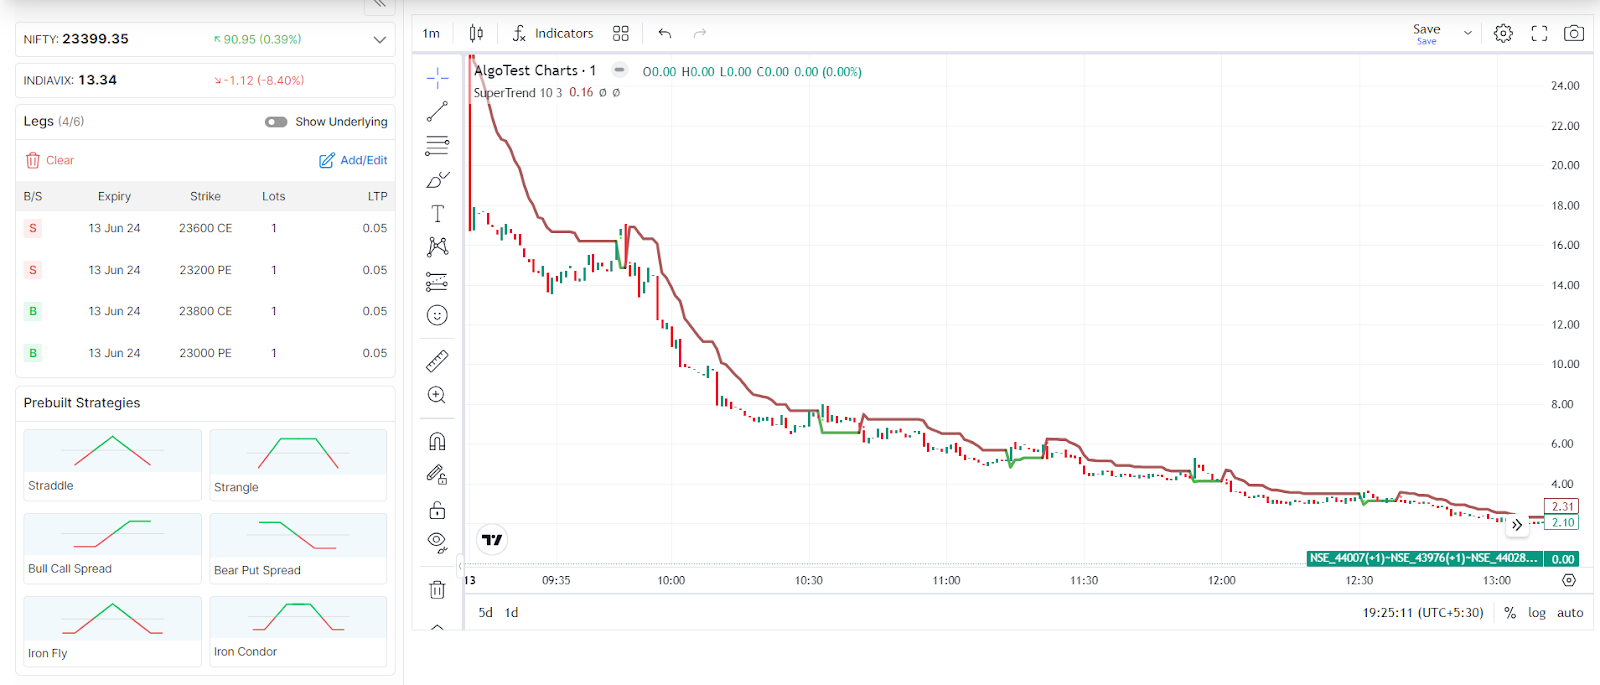
Going forward, you will have the ability to view the option chain and add option legs to see the corresponding chart. For example, if you want to view the current week's straddle chart, you would select the current week expiry (i.e., 13th June), choose the strike, indicate whether you want to buy or sell the option, and then click on 'plot chart' as depicted in the image below.
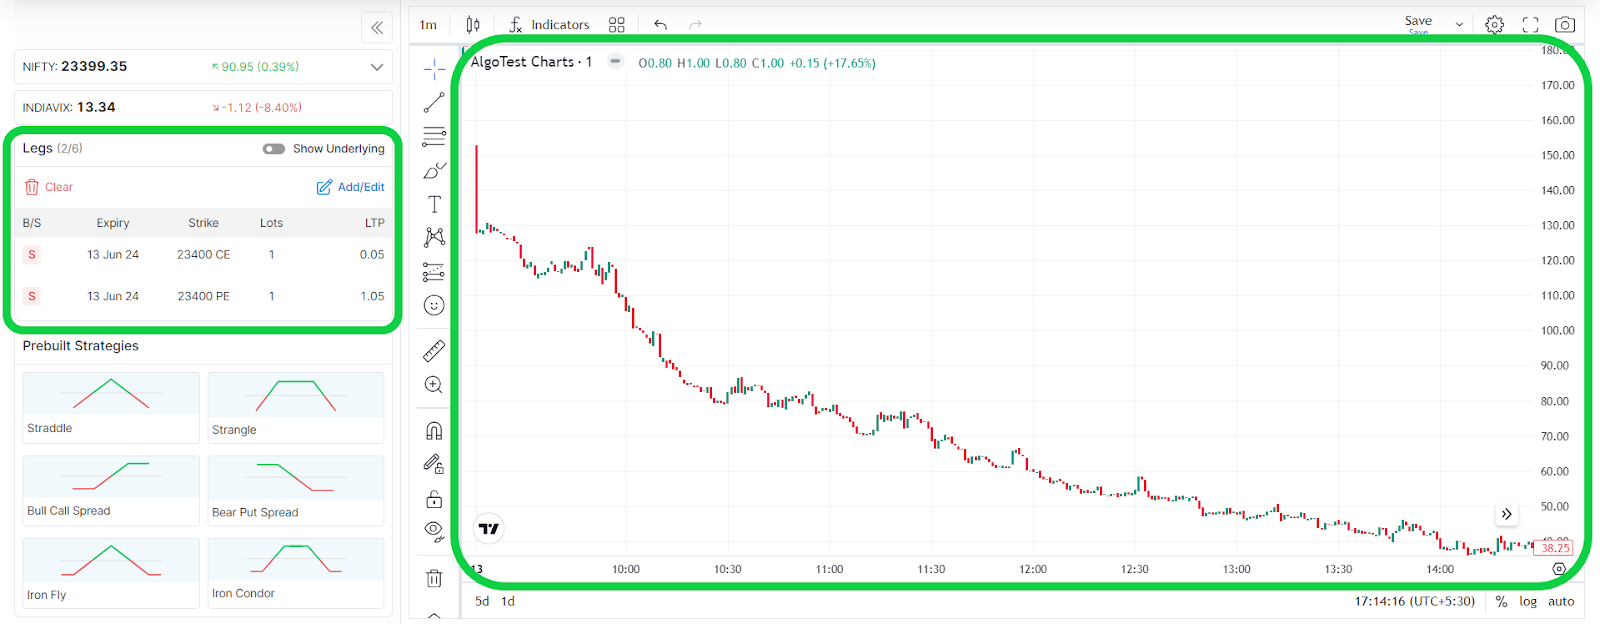
You can now view the At The Money straddle chart in AlgoTest. Additionally, you have the option to add up to 6 legs and view multi-leg charts.
Prebuilt Strategies
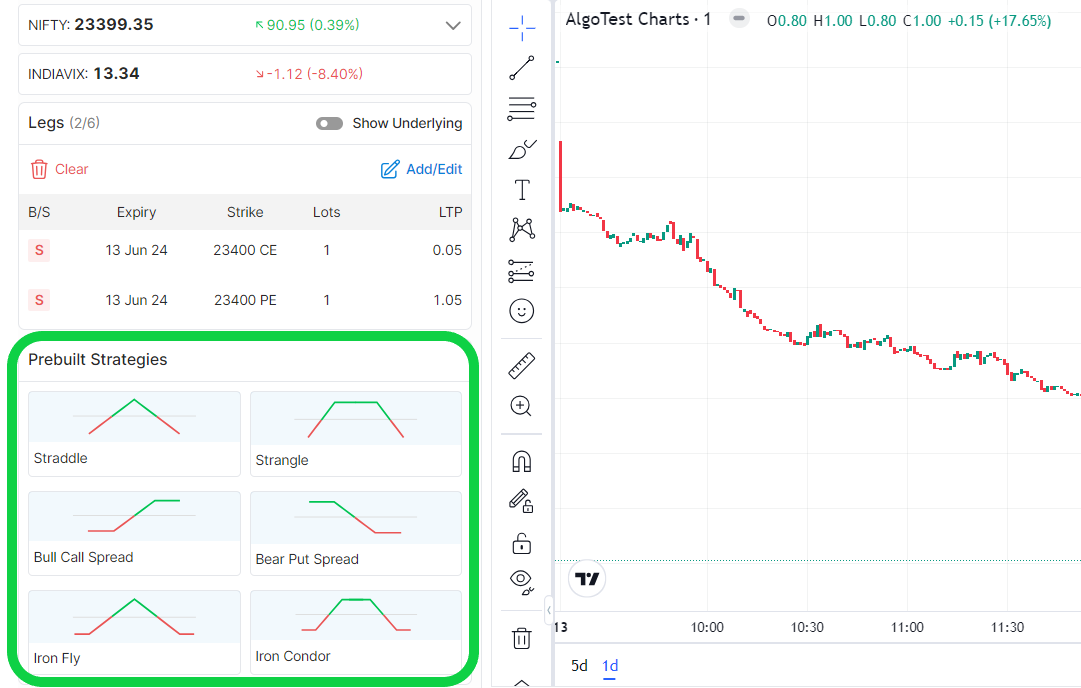
In the "Prebuilt Strategies" section, you can view prebuilt templates of advanced strategies such as Strangle, Straddle, Bull Call Spread, Bull Put Spread, Iron Fly, and Iron Condor. You can easily view the chart of these advanced strategies with just one click.
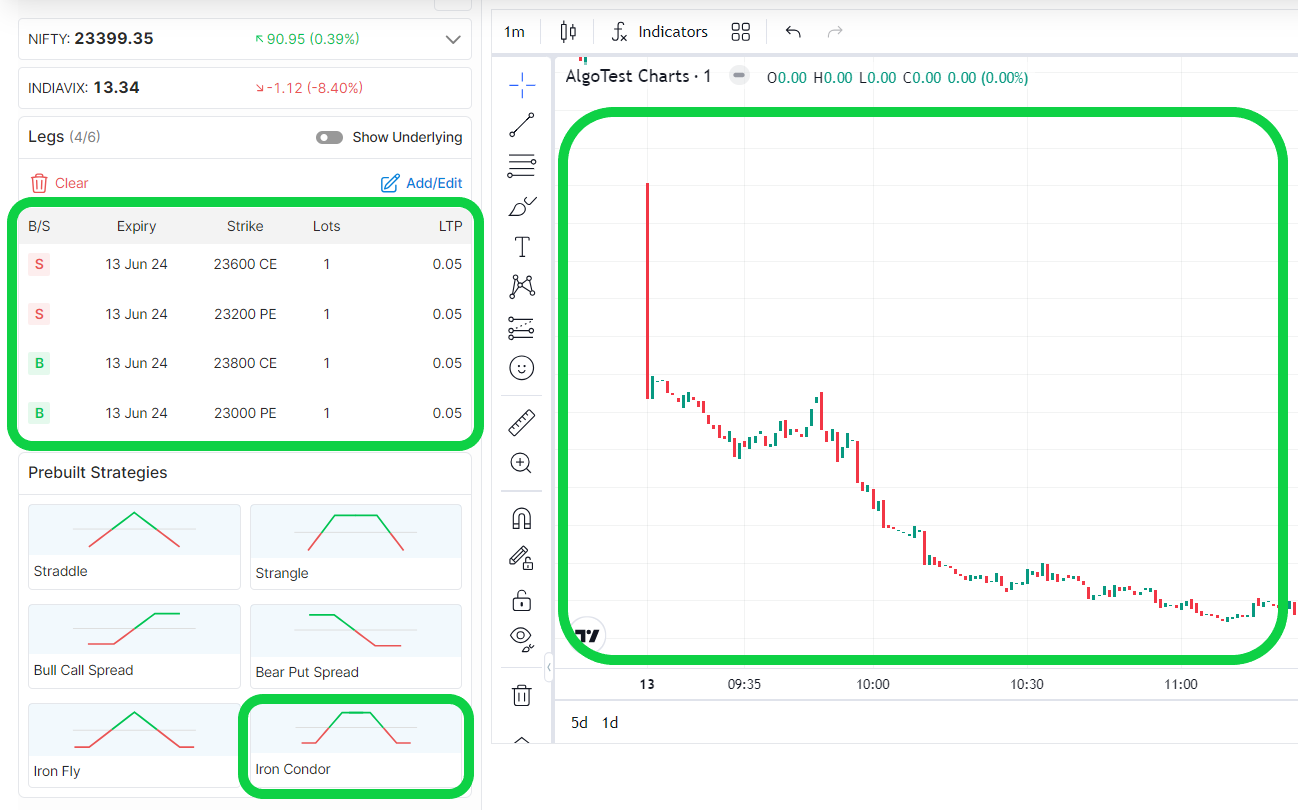
Simply click on one of the prebuilt strategies to view its corresponding chart. For example, if you want to see the chart for the iron condor, click on 'iron condor' and you will be able to view the plotted chart as shown in the image below.
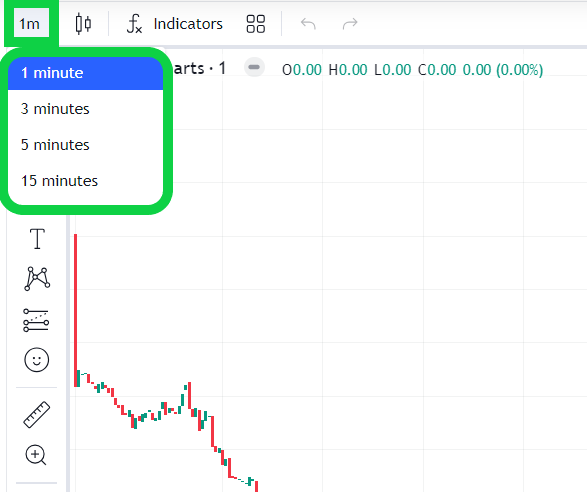
Time Frame
Understanding the impact of timeframe is crucial in trading. As a scalper, shorter time frames are ideal, while trend followers often prefer higher time frames. AlgoTest Charts empowers you to customize the timeframe to your preference.
By default, the chart displays a 1-minute timeframe, but you have the flexibility to adjust it, as demonstrated in the accompanying image. This feature ensures that you have the freedom to tailor your trading experience to best suit your unique strategy and preferences.
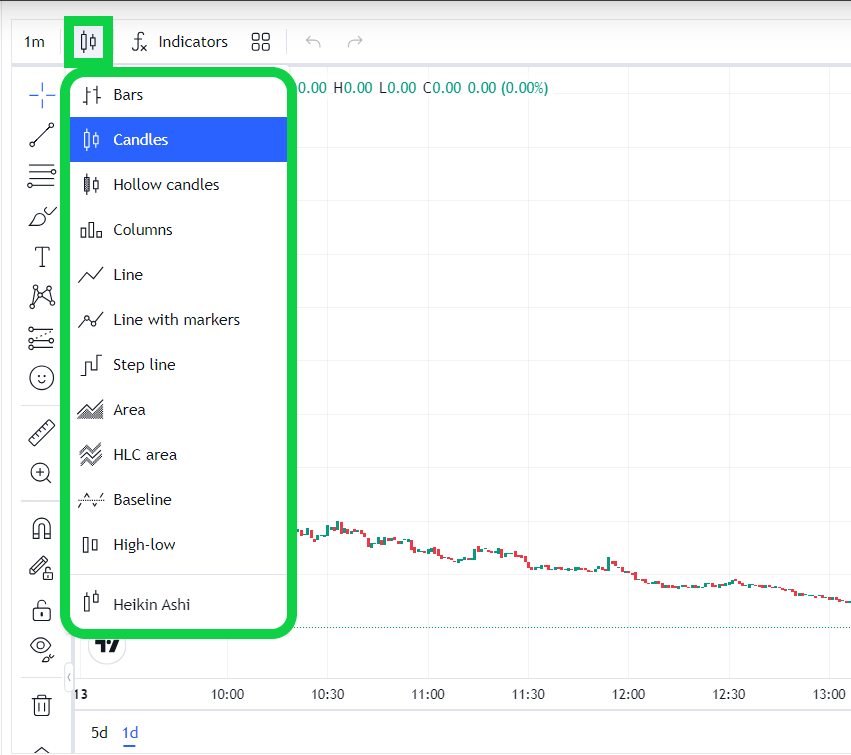
Candle Type
There are numerous fascinating types of candlestick charts that traders love to explore, such as Japanese candlesticks, Heikin-Ashi candlesticks, bar charts, and line charts. Depending on your personal preferences, you can choose the chart type that resonates with you.
AlgoTest Charts provides a diverse range of chart options, allowing you to easily select your preferred chart type. Simply click on the Candle button and choose the chart type that suits your trading style and goals.
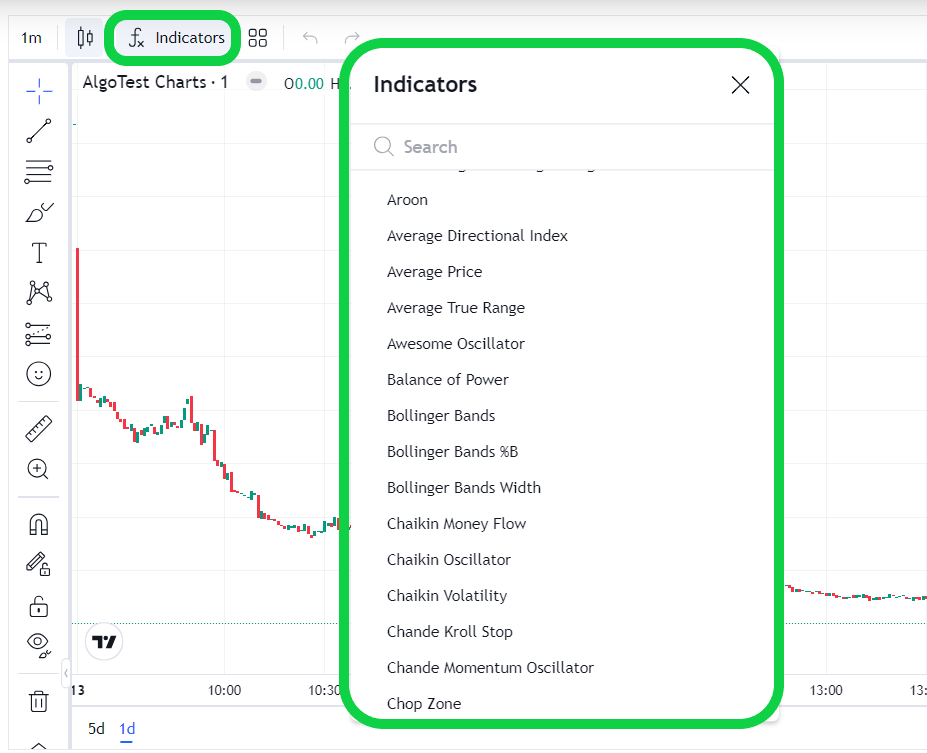
Indicator
Indicator, as the name suggests, is a crucial tool that empowers traders to confidently navigate the decision of whether to buy or sell a stock. This powerful tool is widely utilized by traders to inform their trading decisions, either in combination with price action or independently.
When you explore AlgoTest Charts, you'll discover a wide array of indicators that you can effortlessly apply to your charts, enhancing your trading journey. What sets AlgoTest Charts apart is the capability to apply indicators on straddle/strangle/multi-leg option charts, providing you with valuable insights and options.
To integrate an indicator into your chart, simply click on the indicators button, and a comprehensive list of indicators will be displayed, as illustrated in the image below. This user-friendly interface ensures that you can make informed decisions and optimize your trading experience with ease.
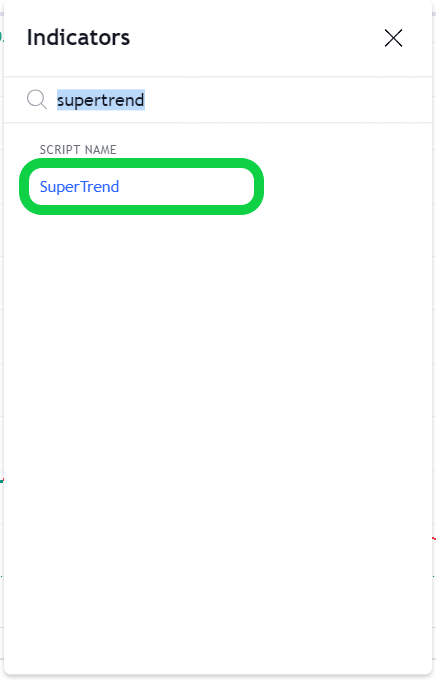
You can also search for your favorite indicator and select it to apply on the charts.
You can now see your indicator on the chart as depicted in the image below.
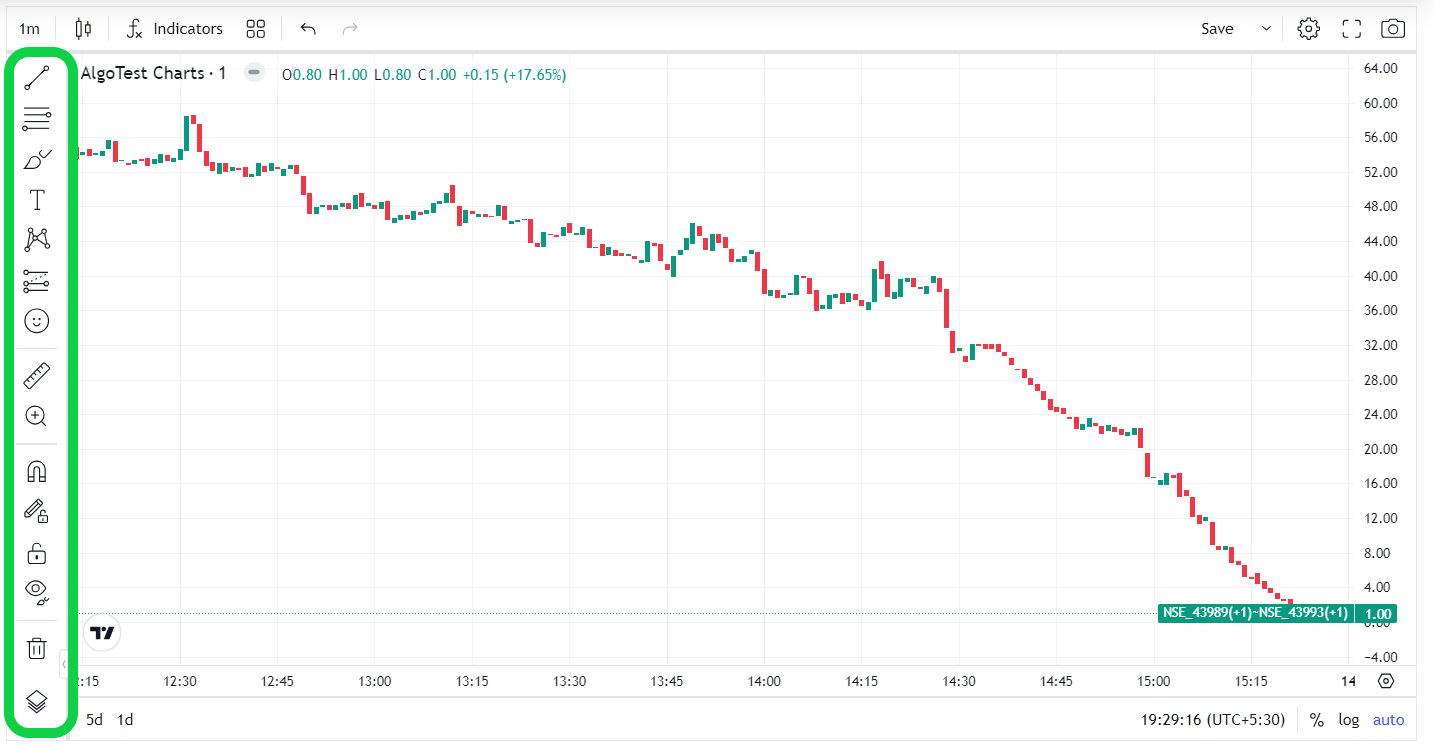
Advanced Tools
In the world of trading, every trader brings their unique style to the table, making the trading landscape wonderfully diverse. There's a wide array of tools at our disposal, allowing us to tailor our approach to match our individual preferences. Some traders rely on support resistance, while others find trendlines or Fibonacci retracement more effective. Then there are those who swear by specific chart patterns like head and shoulder, triangle, elliot waves, and cypher, just to name a few.
When utilised effectively, these tools can truly provide an extra edge that sets us apart from other traders. AlgoTest Charts offers a rich variety of these advanced tools, catering to a diverse range of trading strategies, including straddle, strangle, and multi-leg option charts. Just take a look at the image below to see the wealth of advanced charting tools available, such as Fibonacci, Pitchfork, Patterns, Trendline, and more, all accessible with just a simple click. These tools are here to empower and enhance your trading experience.