Chart Preview
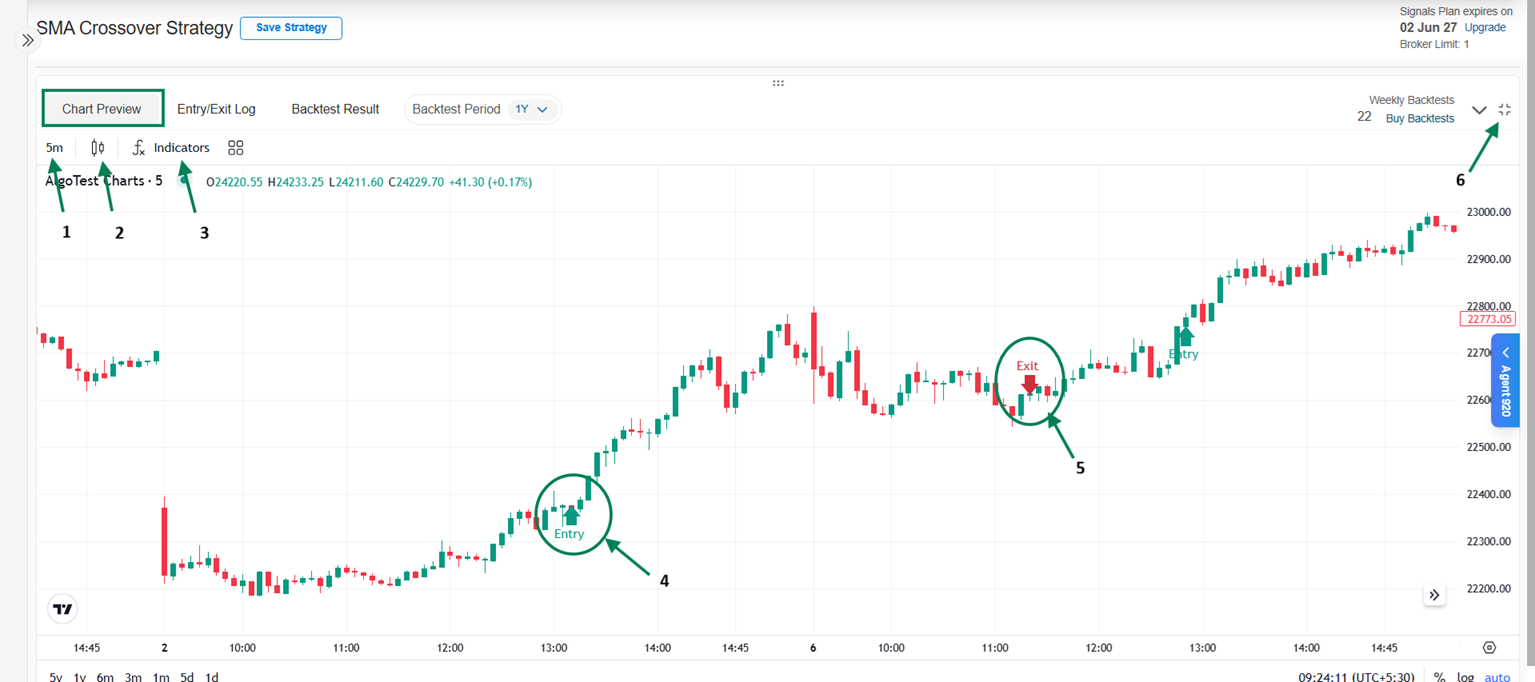
The Chart Preview helps you visualize how your strategy behaves on the chart. Once the Signal strategy conditions are created, you can go to the Chart Preview section to see at what time and date the strategy entered or exited based on the defined conditions.
-
Charts: Displays price movement of the selected instrument. You can add indicators (like EMA, RSI, etc.) as per your strategy requirements.
-
Timeframes: You can select different timeframes (e.g., 1 min, 5 min, 15 min) to evaluate strategy performance based on your trading style.
-
Entry Signals: Shows where the strategy generates buy/sell signals based on defined conditions.
-
Exit Signals: Highlights exit points such as stop loss, target, or condition-based exits, helping you clearly understand trade outcomes.
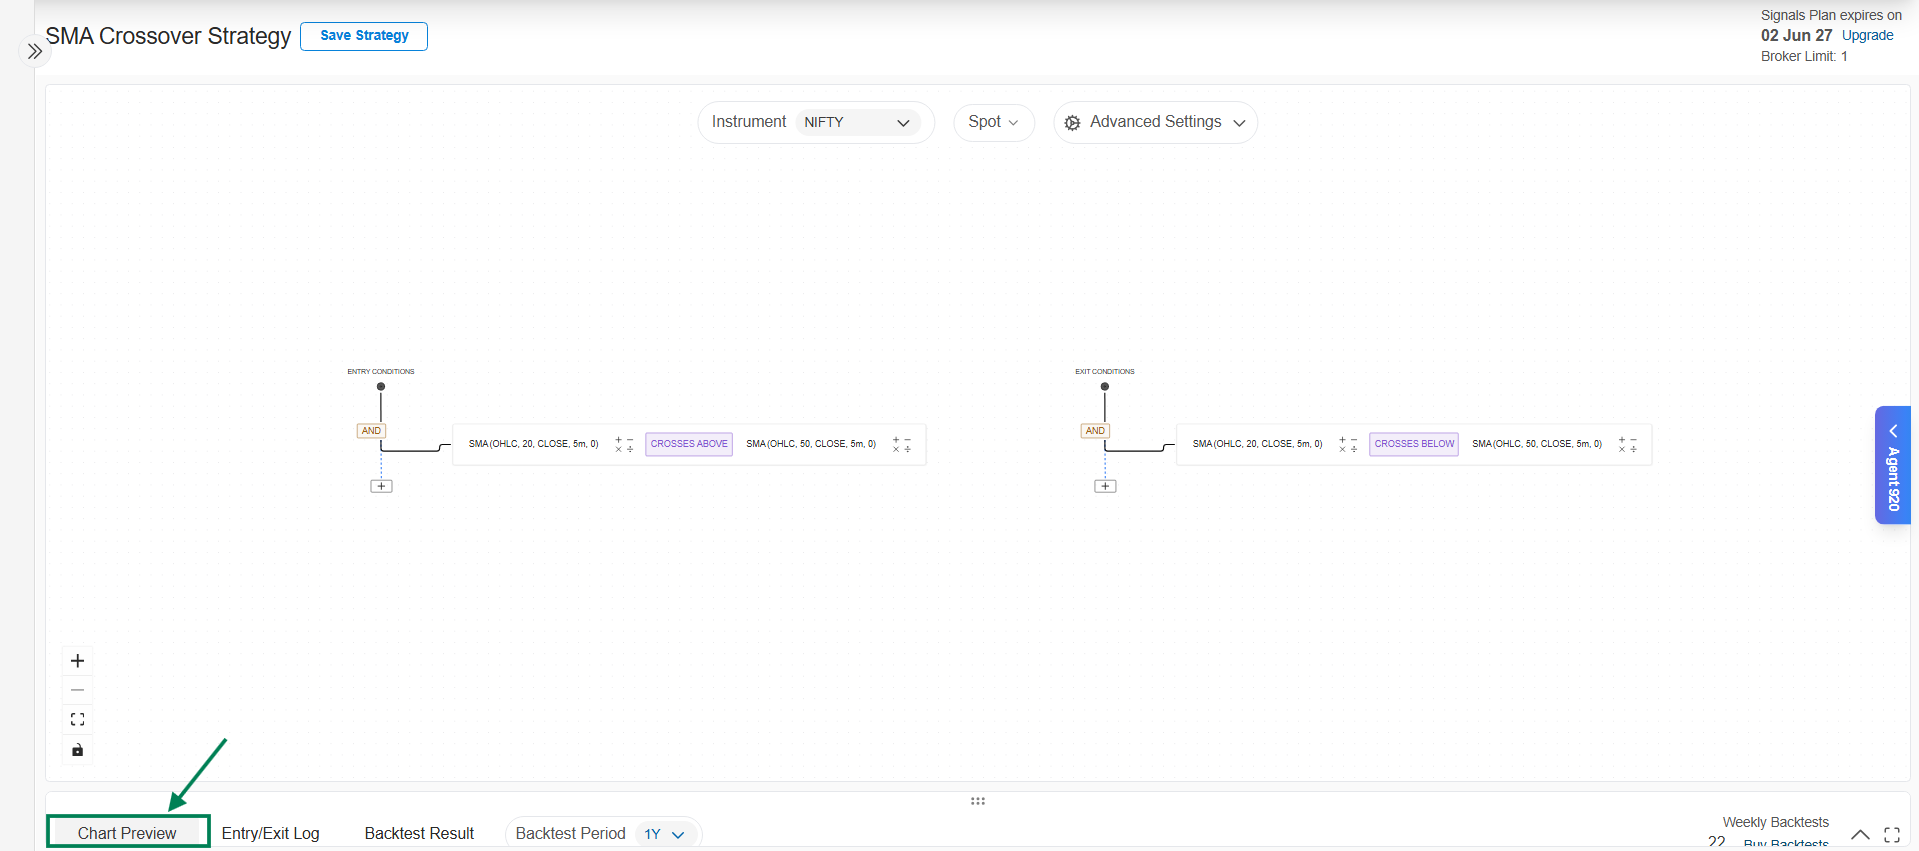
Chart Preview - Key Features
-
Time Frame:
Allows you to select the time interval of the chart (e.g., 1 min, 5 min, 15 min). -
Candle Type:
You can choose different candle formats such as Candlestick, Heikin Ashi, etc., to view price movements in a way that suits your analysis. -
Indicators:
You can add indicators (like EMA, RSI, MACD, etc.) to the chart to validate and analyze your strategy conditions visually. -
Entry Signal:
Displays the exact points on the chart where the strategy generated buy/sell entries based on the defined conditions. -
Exit Signal:
Highlights where the strategy exited trades, such as stop loss hit, target achieved, or condition-based exits. -
Maximize/Minimize:
You can expand the chart for a detailed view or minimize it for quick navigation while working on your strategy.