Trend Indicators
- EMA (Exponential Moving Average): A moving average that gives more weight to recent prices, making it more responsive to current market changes.
-
Helps identify short-term trends and momentum
-
Commonly used for entry/exit signals (e.g., EMA 20/50 crossover)
-
Acts as dynamic support and resistance
-
Advantage over SMA: Provides faster and earlier signals compared to SMA
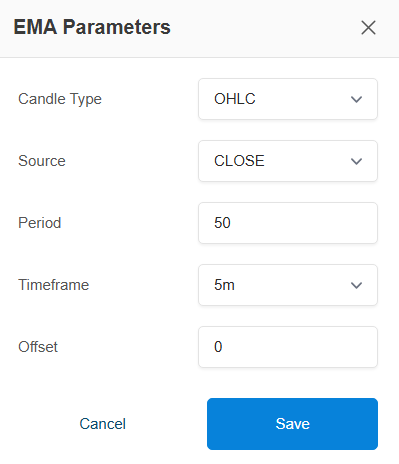
Here are EMA Parameter settings :

Candle Type:

This determines the type of candles used for the calculation. The default is OHLC, but you can also use HEIKIN_ASHI candles, which can help in smoothing out the price action to better identify trends.
Source:

This is the specific price point from each candle that the calculation is based on. These are the four primary data points of any price candle.
-
Close: The closing price of the period.
- Why it's used: This is the most common source because it represents the final consensus of value for that period. Most traders consider the close to be the most significant price. An EMA of the close is excellent for general trend analysis.
-
Open: The opening price of the period.
- Why it's used: Less common for EMA, but can be used to analyze the relationship between the opening price and the moving average, often in opening range breakout strategies.
-
High: The highest price reached during the period.
- Why it's used: An EMA of the high prices will run above the price action. This can be used to create an upper band or a dynamic resistance level. A strategy might exit a long position if the price closes above the EMA of the Highs.
-
Low: The lowest price reached during the period.
- Why it's used: An EMA of the low prices will run below the price action. This is useful for creating a dynamic support level or a trailing stop-loss. For example, a rule could be "exit if the price closes below the EMA of the Lows."
Calculated (Averaged) Price Points
These sources use an average of the candle's prices to create a smoother, more "central" value. This can help reduce the noise from occasional price spikes.
-
OHLC4: (Open + High + Low + Close) / 4
- Why it's used: This gives the "mean price" of the entire candle, providing a more balanced representation of the period's trading activity than the Close alone. It's great for smoothing the EMA and getting a broader sense of the trend.
-
HLC3: (High + Low + Close) / 3
- Why it's used: Often called the "Typical Price." It gives equal weight to the high, low, and closing prices. This is another excellent smoothing technique, often used in indicators like the Commodity Channel Index (CCI).
-
HL2: (High + Low) / 2
- Why it's used: This represents the "Median" or "Midpoint Price" of the candle's trading range. It completely ignores the open and close. This source is useful if you believe the true price lies in the middle of the period's range, and you want to filter out the noise from the open and close values.
- Period: This is the lookback window for the calculation.

-
A shorter period (e.g., 10, 20) makes the EMA react more quickly to price changes, tracking it more closely.
-
A longer period (e.g., 50, 200) makes the EMA smoother and less sensitive to short-term price fluctuations.
Timeframe : The chart interval for the indicator's data.
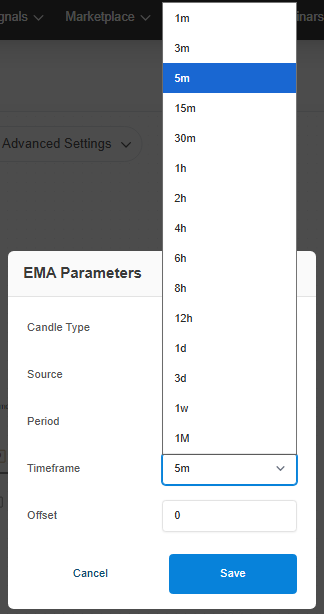
Offset: The Offset setting allows you to look back at an indicator's value from a previous candle. It's like asking, "What was the value of this indicator N candles ago?"

-
offset: 0: Refers to the current, still-forming candle.
-
offset: 1: Refers to the most recently completed candle (the previous candle).
-
offset: 2: Refers to the candle before the previous one, and so on.
In summary, the EMA is a versatile tool for identifying trend direction. A common strategy involves using two EMAs—a short-period one and a long-period one—and looking for a crossover to signal a potential trend change.
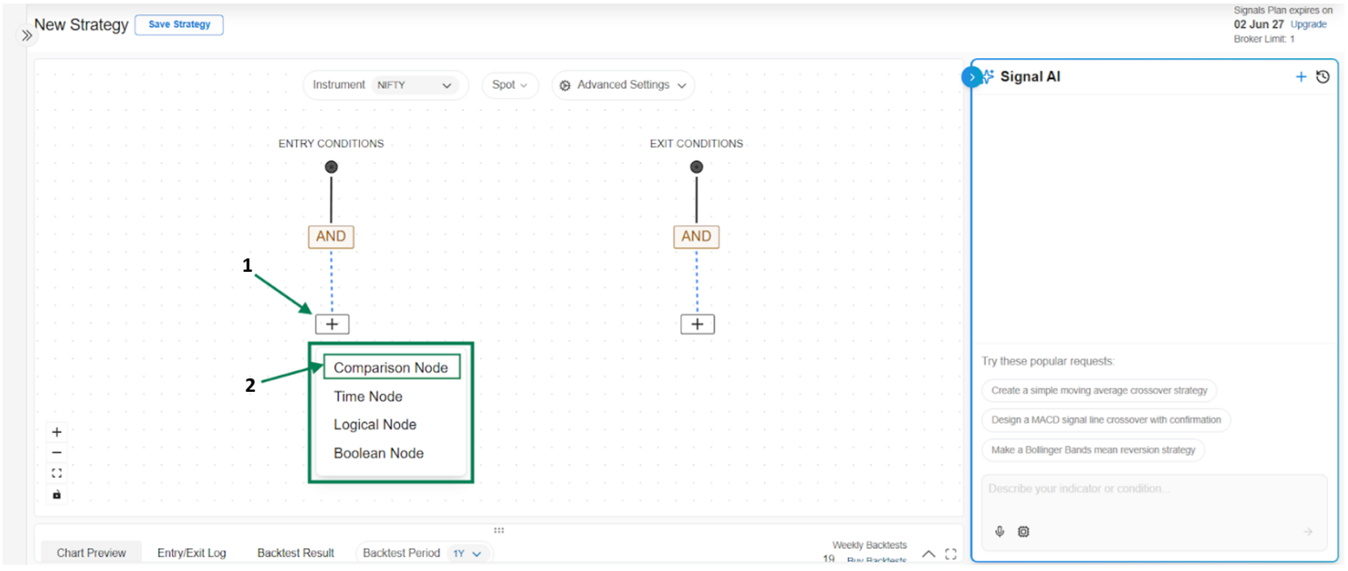
**→ Steps to Create a EMA 20/50 Cross Over Signal based strategy **
-
On Entry Condition, click on “+” and select Comparison Node
-
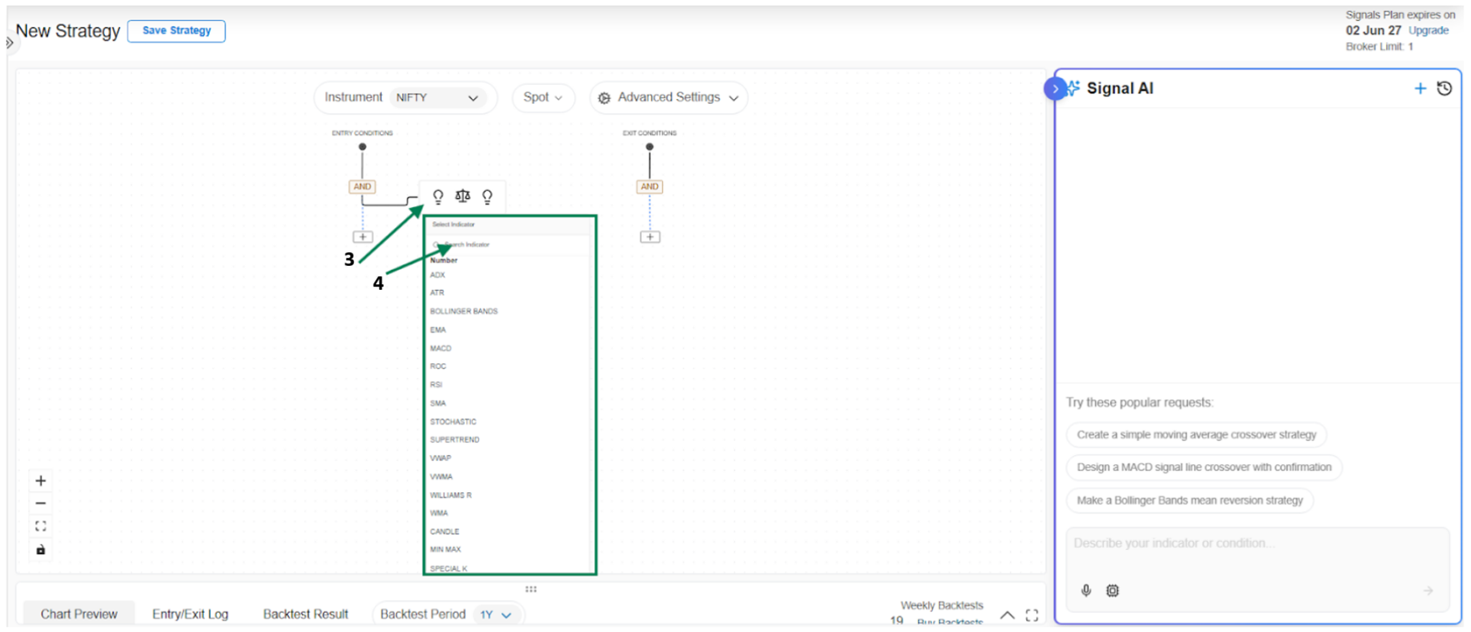
Search and select EMA indicator
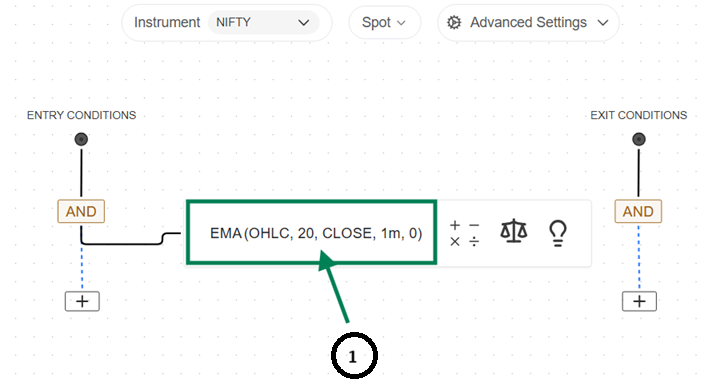
- Click and Set Fast EMA Indicator Input Settings and save
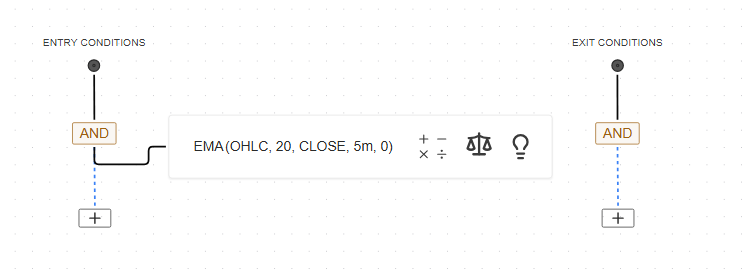
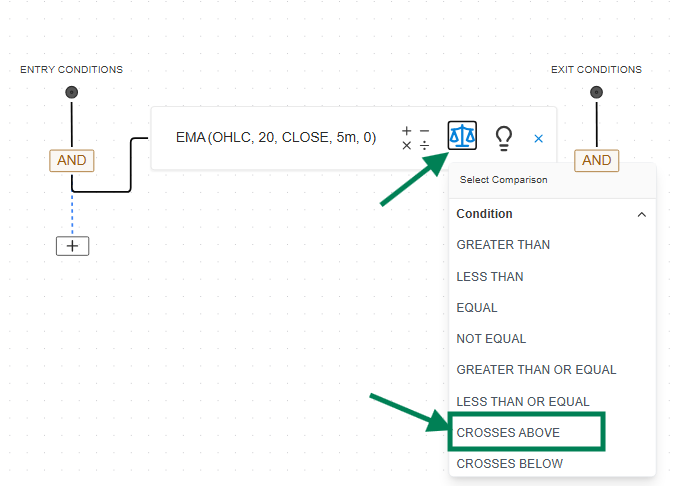
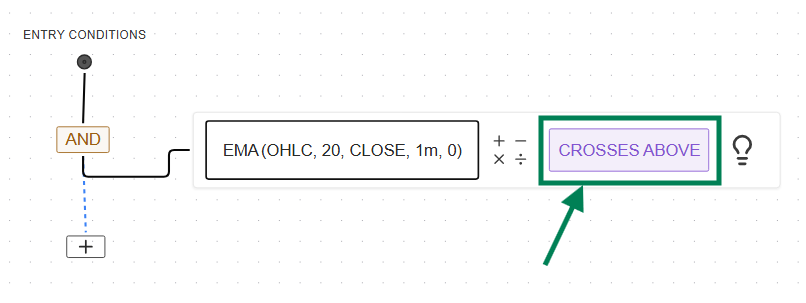
- Add comparison → select “Crosses Above”
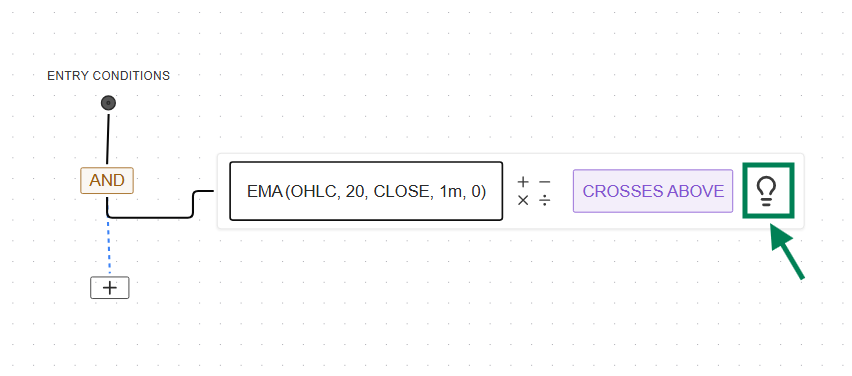
- Follow the same process for Slow EMA 50.
→ Search and select EMA, then set Indicator settings accordigly EMA 50 and save.

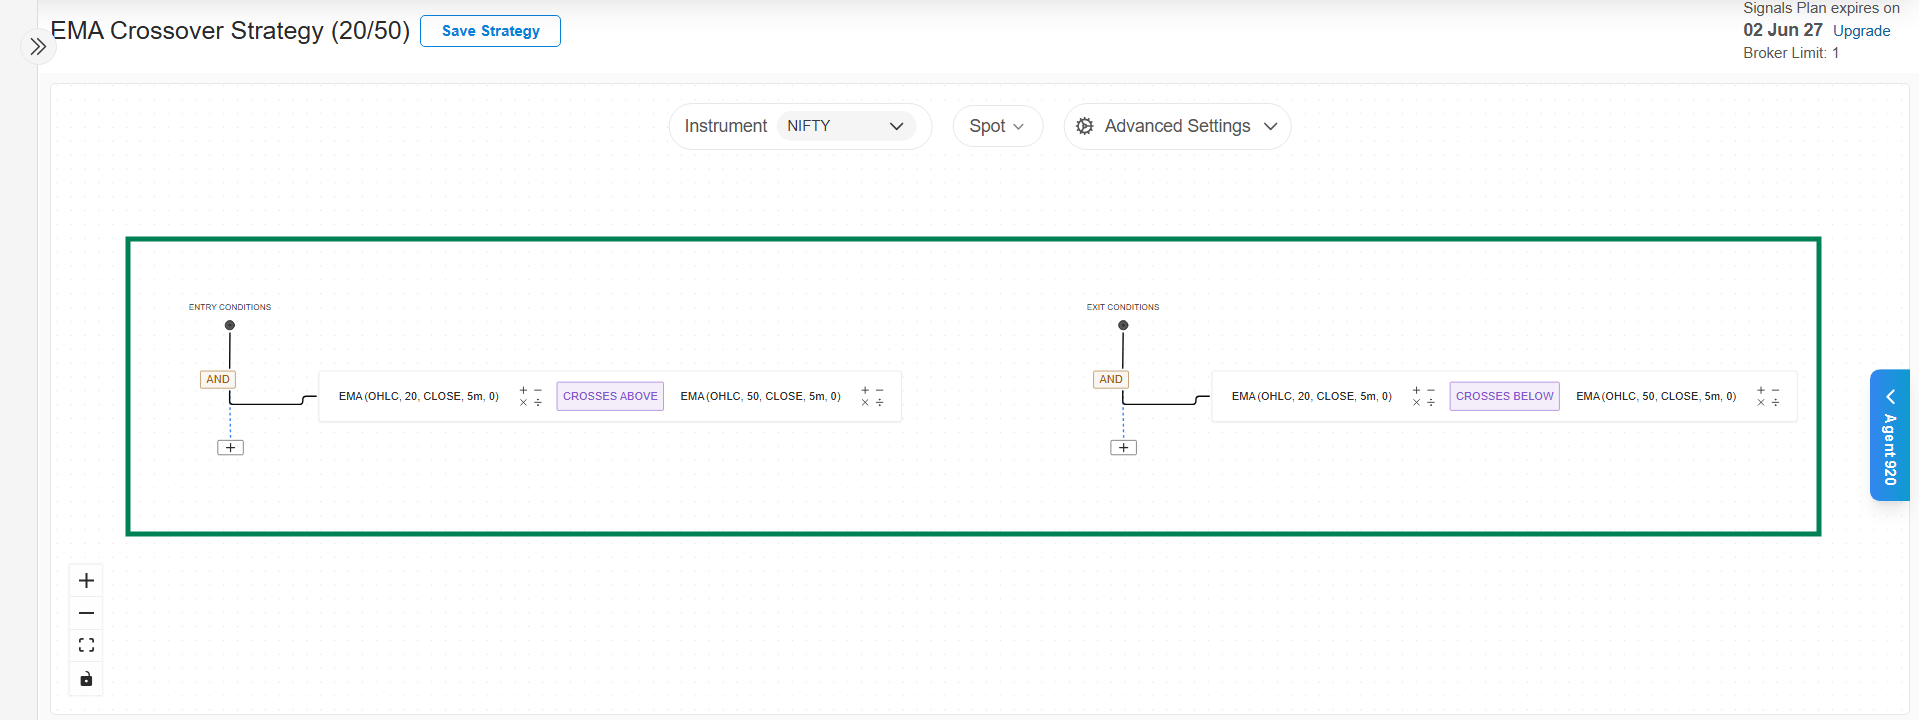
→ Quick Steps : EMA 20/50 Crossover Strategy creation
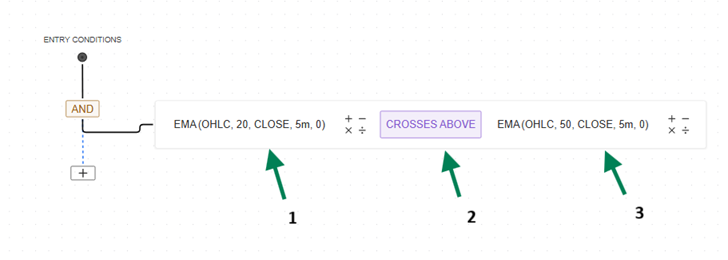
→ Entry Condition: The 20-period EMA crosses above the 50-period EMA.
-
Click on “+” under Entry Condition, select Comparison Node, and add EMA (20) with inputs: Candle Type (OHLC), Source (Close), Period = 20, Timeframe (e.g., 5m)
-
Add comparison and select “Crosses Above”
-
Add EMA (50) with inputs: Candle Type (OHLC), Source (Close), Period = 50, same timeframe

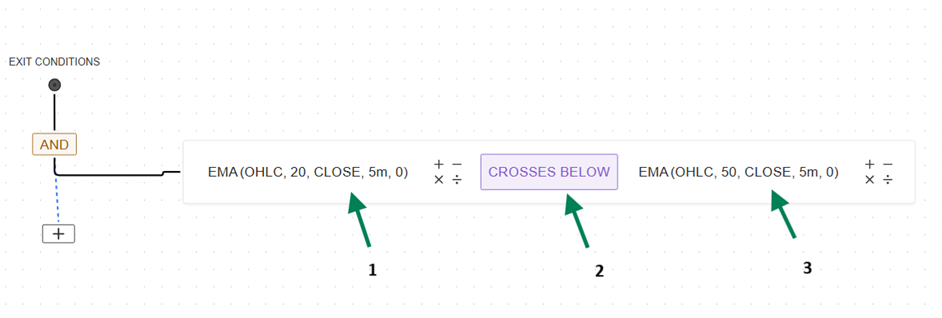
→ Exit Condition: The 20-period EMA crosses below the 50-period EMA.
-
Click on “+” under Exit Condition, select Comparison Node, and add EMA (20) with inputs: Candle Type (OHLC), Source (Close), Period = 20, Timeframe (e.g., 5m)
-
Add comparison and select “Crosses Below”
-
Add EMA (50) with inputs: Candle Type (OHLC), Source (Close), Period = 50, same timeframe

This creates the final Signal strategy: Buy when EMA 20 crosses above EMA 50 and exit when it crosses below on a 5-minute timeframe.
→ In a similar way users can explore the different available Indicators.
2. SMA (Simple Moving Average):
A moving average that calculates the average price over a specific period with equal weight to all data points. It provides a smooth trend line by reducing market noise.
-
Identifies long-term trends
-
Acts as support and resistance
-
Useful for trend confirmation
→ Here are SMA Parameter settings :
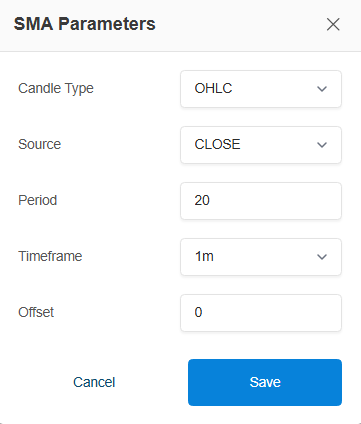
User Guide: SMA Indicator Input Settings
-
Candle Type (Dropdown):
Select the candle format for calculation
Example: OHLC / Heikin Ashi -
Source (Dropdown):
Choose the price type used for SMA calculation
Options include: Open, High, Low, Close, OHLC4, HLC3, HL2 -
Period (Input Field):
Set the SMA period
Example: 20 (SMA 20), 50 (SMA 50) -
Timeframe (Dropdown):
Select the timeframe for the indicator
Example: 1m, 5m, 15m, 1H, etc. -
Offset (Optional):
Adjust the SMA forward/backwards if required
Use these settings to configure SMA before applying it to your strategy conditions.
→ SMA 9/21 Crossover Strategy:
Entry Condition: The strategy will generate a buy signal when the 9-period SMA crosses above the 21-period SMA on a 5-minute timeframe.
Exit Condition: The position will be exited when the 9-period SMA crosses below the 21-period SMA.
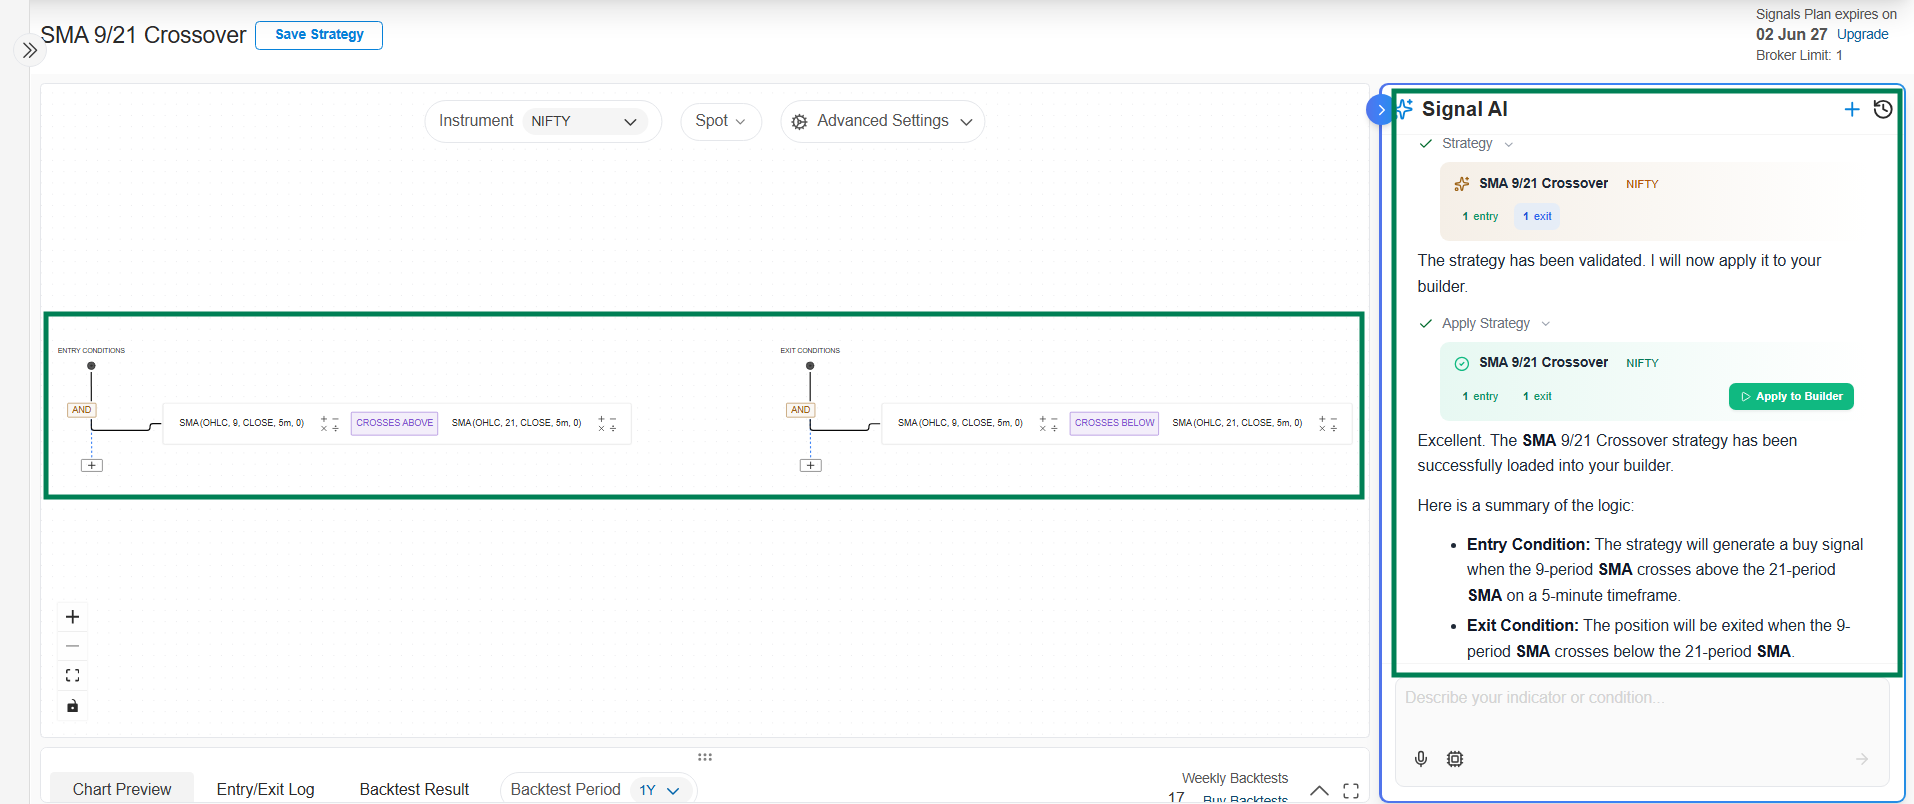
Here is a summary of the SMA 9/21 Crossover strategy:
-
Strategy Name: SMA 9/21 Crossover
-
Instrument: NIFTY Index
-
Timeframe: 5 minutes
-
Entry Signal: Triggers when the SMA with a period of 9 crosses above the SMA with a period of 21.
Exit Signal: Triggers when the SMA with a period of 9 crosses below the SMA with a period of 21.
3. WMA (Weighted Moving Average)
WMA is a technical indicator that, like other moving averages, helps to smooth out price data to show the trend direction.
The key feature of a WMA is that it places greater weight on the most recent price data and less weight on older data. This makes it more responsive to new information than a Simple Moving Average (SMA).
→ Here are all the available settings for the WMA ( Weighted Moving Average) indicator:

-
Candle Type: This determines the type of candles used for the calculation.
The default is OHLC (standard candles).
You can also use HEIKIN_ASHI candles, which can help filter out market noise.
Source: This is the price point from the candle that the calculation is based on.
The most common setting is CLOSE, but you can also use OPEN, HIGH, or LOW.
Period: This is the lookback period, or the number of candles the indicator uses for its calculation.
A shorter period (e.g., 10) will make the WMA react very quickly to price changes.
A longer period (e.g., 50) will create a smoother line that is less sensitive to short-term price noise.
The default is typically 20.
-
Timeframe (Dropdown):
Select the timeframe for the indicator
Example: 1m, 5m, 15m, 1H, etc. -
Offset: The Offset setting allows you to look back at an indicator's value from a previous candle. It's like asking, "What was the value of this indicator N candles ago?"
-
offset: 0: Refers to the current, still-forming candle.
-
offset: 1: Refers to the most recently completed candle (the previous candle).
-
offset: 2: Refers to the candle before the previous one, and so on.
These settings allow you to customize the WMA to fit your specific trading style and timeframe.
→ WMA Strategy: Dual Weighted Moving Average
-
Entry: The short-term WMA (period 9) crosses above the long-term WMA (period 21).
-
Exit: The short-term WMA (period 9) crosses below the long-term WMA (period 21).\
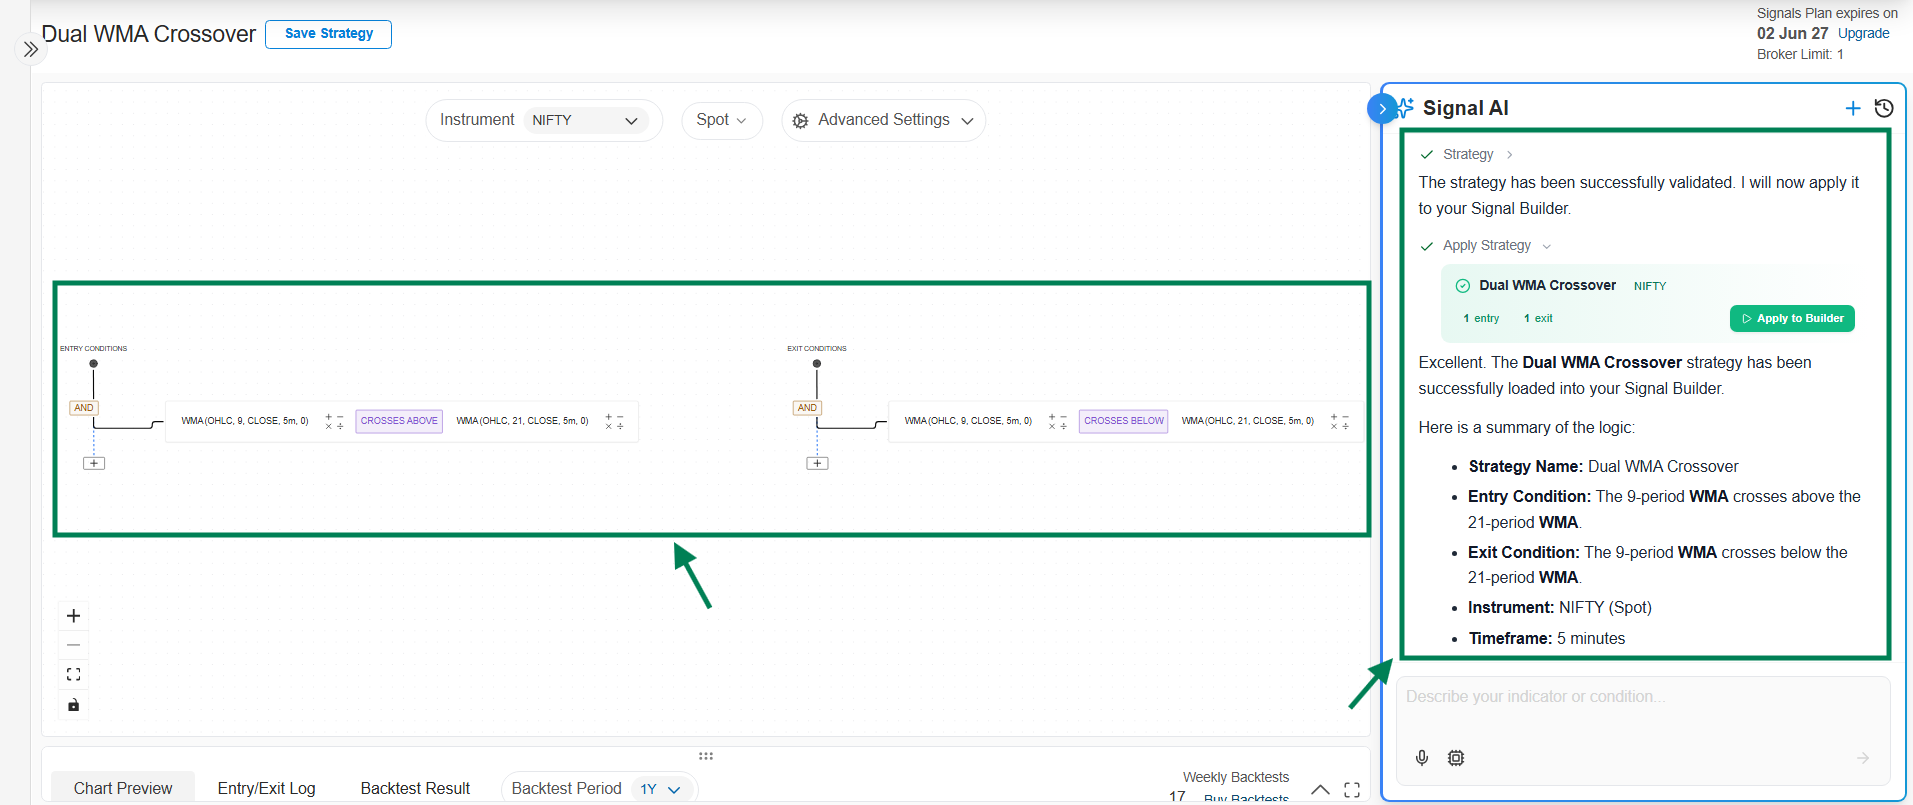
Here is a summary of the logic:
-
Strategy Name: Dual WMA Crossover
-
Entry Condition: The 9-period WMA crosses above the 21-period WMA.
-
Exit Condition: The 9-period WMA crosses below the 21-period WMA.
-
Instrument: NIFTY (Spot)
-
Timeframe: 5 minutes
4. VWMA (Volume-Weighted Moving Average) : The VWMA (Volume-Weighted Moving Average) is a technical indicator that calculates the average price of an asset over a specific period, with an emphasis on trading volume. Unlike a Simple Moving Average (SMA) where all price points are weighted equally, the VWMA gives more weight to price points that occurred with higher trading volume.
The core idea is that price movements accompanied by high volume are more significant than movements with low volume. This makes the VWMA a more dynamic and often more responsive indicator for confirming trends.
Common VWMA Strategy: Price Crossover
A popular and straightforward strategy using the VWMA is the price crossover:
-
Buy Signal (Bullish): A potential buy signal is generated when the asset's price crosses above the VWMA line. This indicates that the price is gaining upward momentum, and this move is supported by volume, suggesting a potential start of an uptrend.
-
Sell Signal (Bearish): A potential sell signal is generated when the asset's price crosses below the VWMA line. This suggests that the upward momentum is fading or a downtrend is beginning, as confirmed by volume-weighted price action.
→ Here are all the available settings for the VWMA ( Weighted Moving Average) indicator:
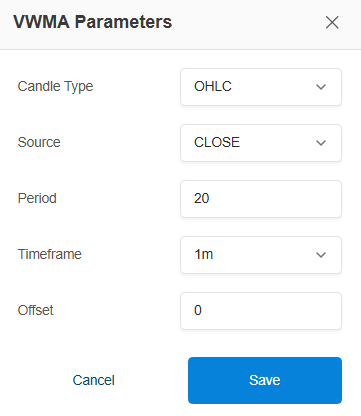
Candle Type: This determines the type of candles used for the calculation.
The default is OHLC (standard candles).
You can also use HEIKIN_ASHI candles, which can help filter out market noise.
Source: This is the price point from the candle that the calculation is based on.
The most common setting is CLOSE, but you can also use OPEN, HIGH, or LOW.
Period: This is the lookback period, or the number of candles the indicator uses for its calculation.
A shorter period (e.g., 10) will make the VWMA react very quickly to price changes.
A longer period (e.g., 50) will create a smoother line that is less sensitive to short-term price noise.
The default is typically 20.
-
Timeframe (Dropdown):
Select the timeframe for the indicator
Example: 1m, 5m, 15m, 1H, etc.
\ -
Offset: The Offset setting allows you to look back at an indicator's value from a previous candle. It's like asking, "What was the value of this indicator N candles ago?"
-
offset: 0: Refers to the current, still-forming candle.
-
offset: 1: Refers to the most recently completed candle (the previous candle).
-
offset: 2: Refers to the candle before the previous one, and so on.
These settings allow you to customize the VWMA to fit your specific trading style and timeframe.
5. SUPERTREND: The SuperTrend is a popular trend-following indicator used to identify the direction of a trend and potential reversal points. It is plotted on the price chart and its position relative to the price indicates the current trend.
\
How it Works: The indicator is calculated using the Average True Range (ATR), which measures market volatility.
\
Uptrend (Bullish Signal): When the SuperTrend line is below the price, it signals an uptrend. Typically, the line is colored green during this phase.
Downtrend (Bearish Signal): When the SuperTrend line is above the price, it signals a downtrend. The line is usually colored red.
A change in the trend is signaled when the price crosses the SuperTrend line, causing the line to flip to the other side of the price.
Key Parameters
Period: This is the lookback period used to calculate the Average True Range (ATR). A common default value is 10.
Multiplier: This is the value by which the ATR is multiplied to set the distance of the indicator line from the price. A common default value is 3.
Increasing the multiplier makes the indicator less sensitive to price changes, leading to fewer signals. Decreasing it makes it more sensitive, resulting in more signals.
How to Use It in Trading
\
Entry Signal: A buy signal is generated when the indicator flips from being above the price to below it. A sell signal is generated when it flips from below to above.
Stop Loss: The SuperTrend line itself can be used as a trailing stop-loss. For a long position, the stop-loss can be placed at the indicator line, and for a short position, it can be placed above it.
It is most effective in trending markets and can produce false signals in sideways or ranging markets. Therefore, it's often used in combination with other indicators for confirmation.
\
→ Here are all the available settings for the SUPERTREND indicator:

User Guide: Supertrend Indicator Input Settings
-
Candle Type (Dropdown):
Select the candle format for calculation
Example: OHLC / Heikin Ashi -
Period (Input Field):
Set the ATR period used in Supertrend calculation
Example: 10 -
Multiplier (Input Field):
Define the multiplier for ATR to adjust sensitivity
Example: 3 -
Timeframe (Dropdown):
Select the timeframe for the indicator
Example: 1m, 5m, 15m, 1H, etc.
\ -
Offset: The Offset setting allows you to look back at an indicator's value from a previous candle. It's like asking, "What was the value of this indicator N candles ago?"
-
offset: 0: Refers to the current, still-forming candle.
-
offset: 1: Refers to the most recently completed candle (the previous candle).
-
offset: 2: Refers to the candle before the previous one, and so on.
Use these settings to configure Supertrend before applying it to your strategy conditions.
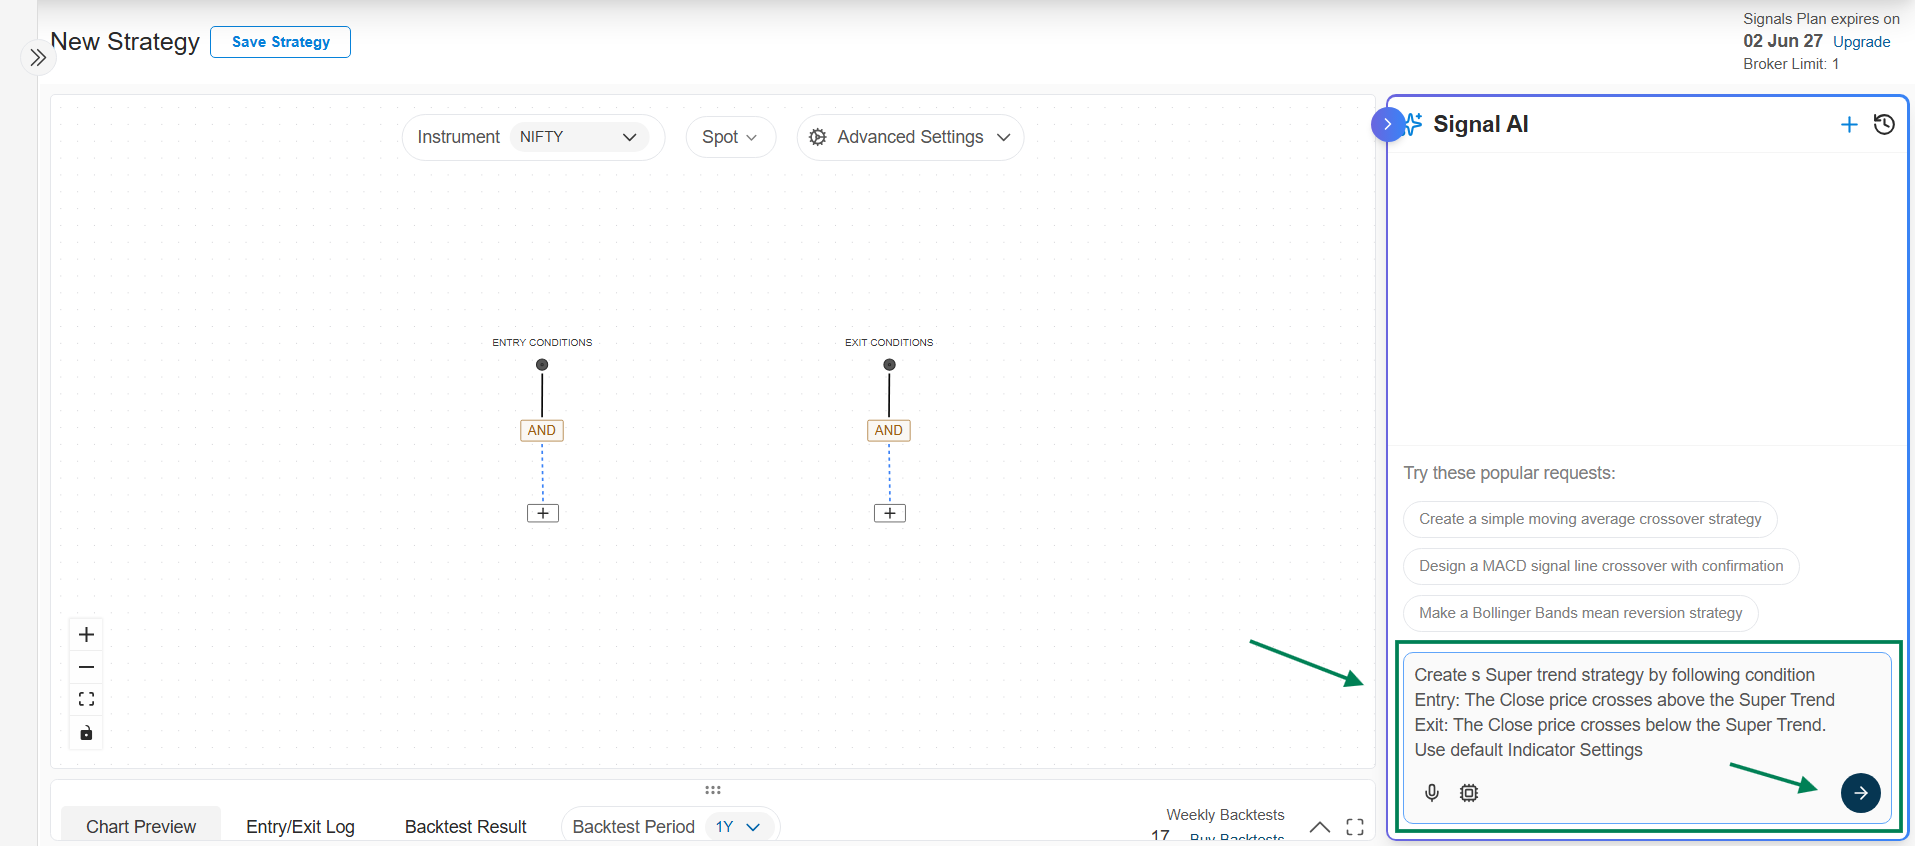
→ Let’s Build SuperTrend Strategy using Signal AI Agent Chat Bot
1. Signal AI Agent Input: Create a Super trend strategy by following conditions.
Entry: The Close price crosses above the Super Trend.
Exit: The Close price crosses below the Super Trend. Use default Indicator Settings
2. Here is SuperTrend Crossover Strategy
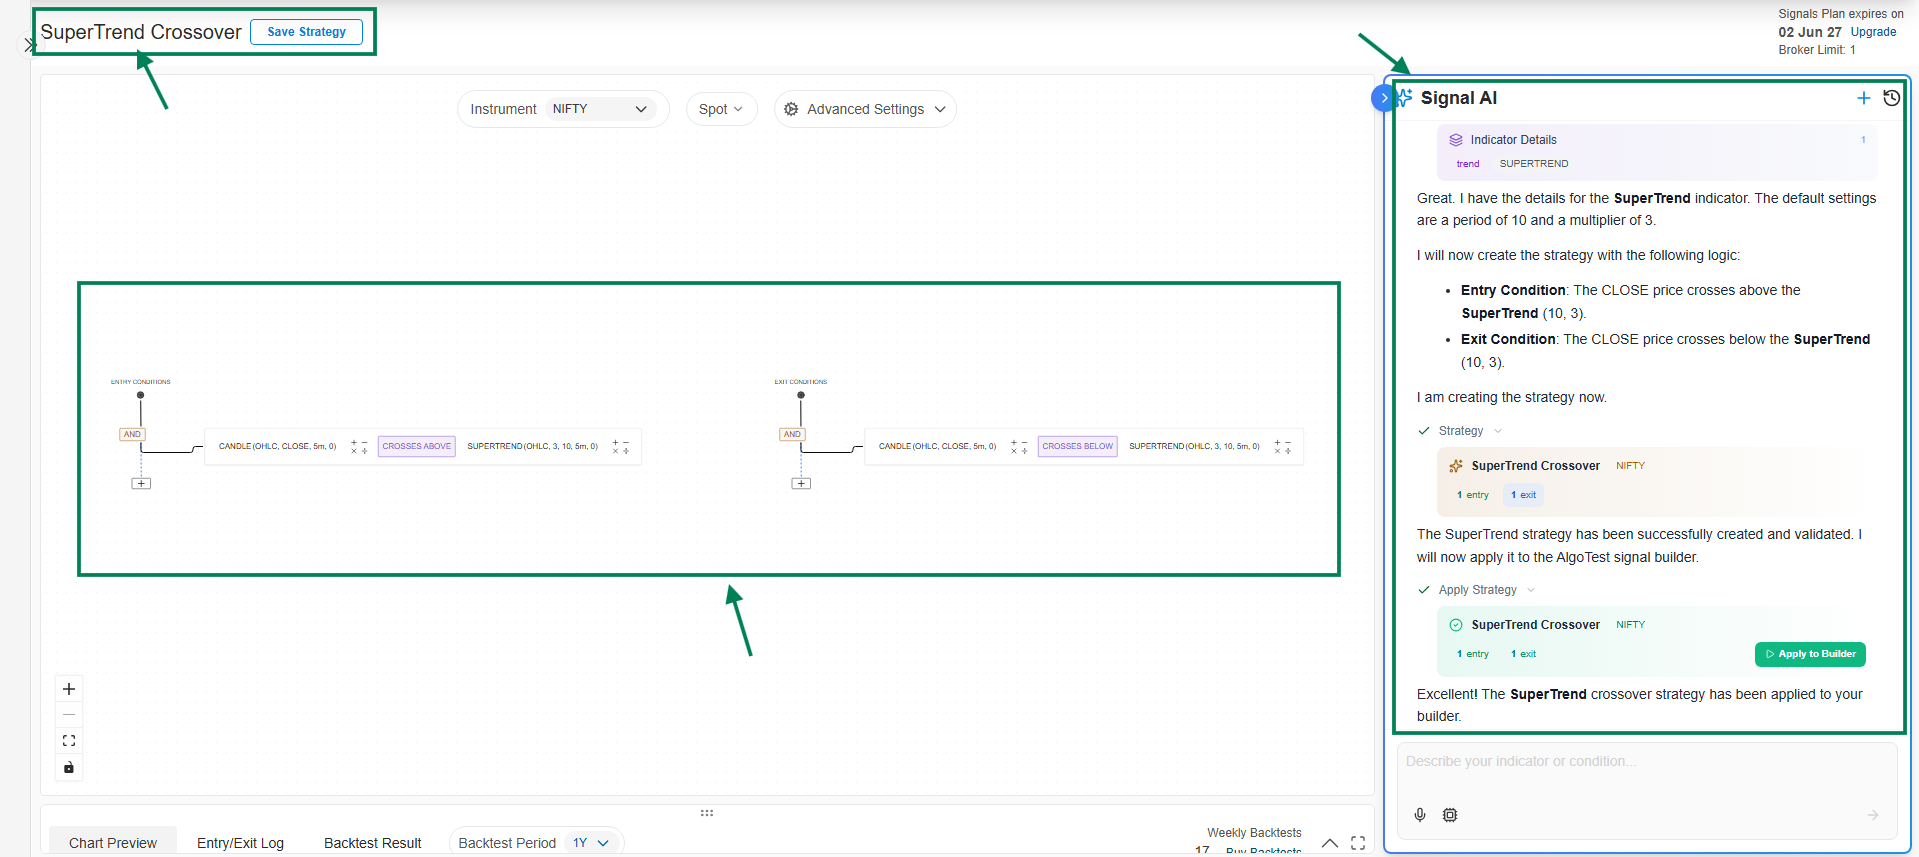
Here is a summary of the "SuperTrend Strategy":
-
Strategy Name: SuperTrend Strategy
-
Underlying Instrument: NIFTY (Spot)
-
Timeframe: 5 minutes
-
Entry Condition: A trade is entered when the CLOSE price of a candle crosses above the SuperTrend indicator (with period 10 and multiplier 3).
-
Exit Condition: The trade is exited when the CLOSE price of a candle crosses below the SuperTrend indicator.
-
Trend Indicators
6. ADX Indicator Overview
The ADX is a technical indicator used to determine the strength of a market trend, not its direction. It is composed of three lines:
-
ADX Line: This is the main line. A reading above 25 typically indicates a strong trend (either bullish or bearish), while a reading below 20 suggests a weak or non-trending market.
-
+DI (Positive Directional Indicator): This line measures the strength of the upward price movement.
-
-DI (Negative Directional Indicator): This line measures the strength of the downward price movement.
The primary purpose of the ADX is to filter out trades during weak trend periods and confirm trades when the trend is strong.
Common ADX Strategy
\
A popular strategy involves using the ADX line to gauge trend strength and the crossover of the +DI and -DI lines to determine the direction and timing of the trade.
Buy Signal (Long Entry): A potential buy signal is generated when two conditions are met simultaneously:
-
The ADX line is greater than 25 (confirming a strong trend).
-
The +DI line crosses above the -DI line (indicating bullish momentum).
Sell Signal (Long Exit or Short Entry): A potential sell signal is generated when:
- The +DI line crosses below the -DI line.
Indicator Input Settings
The ADX indicator has the following main parameters:
| Parameter | Description | Default Value |
|---|---|---|
| period | The lookback period used to calculate the indicator. | 14 |
| adx_component | The specific line of the indicator to use in a condition. You can choose between ADX, PLUS_DI, or MINUS_DI. | ADX |
For example, when building a condition, you would specify which of the three lines you want to compare.
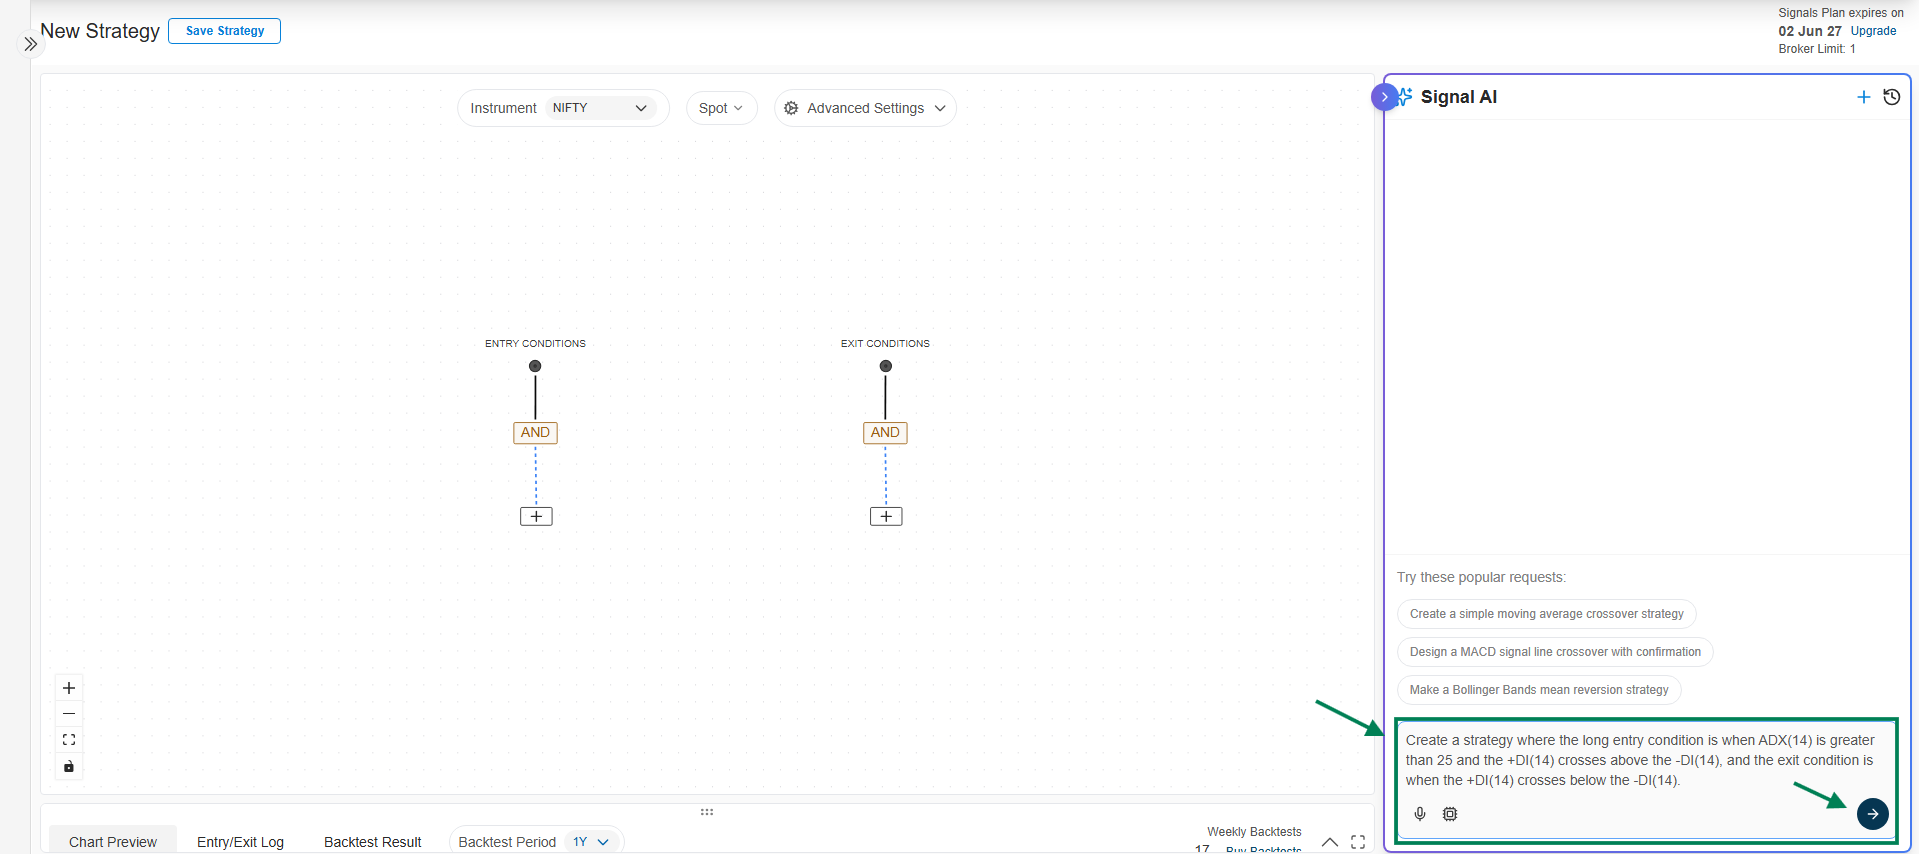
→ Lets Build ADX Crossover Strategy using Signal AI:
Strategy Condition: Create a strategy where the long entry condition is when ADX(14) is greater than 25 and the +DI(14) crosses above the -DI(14), and the exit condition is when the +DI(14) crosses below the -DI(14).
→ **Here is the ADX Indicator Strategy: **
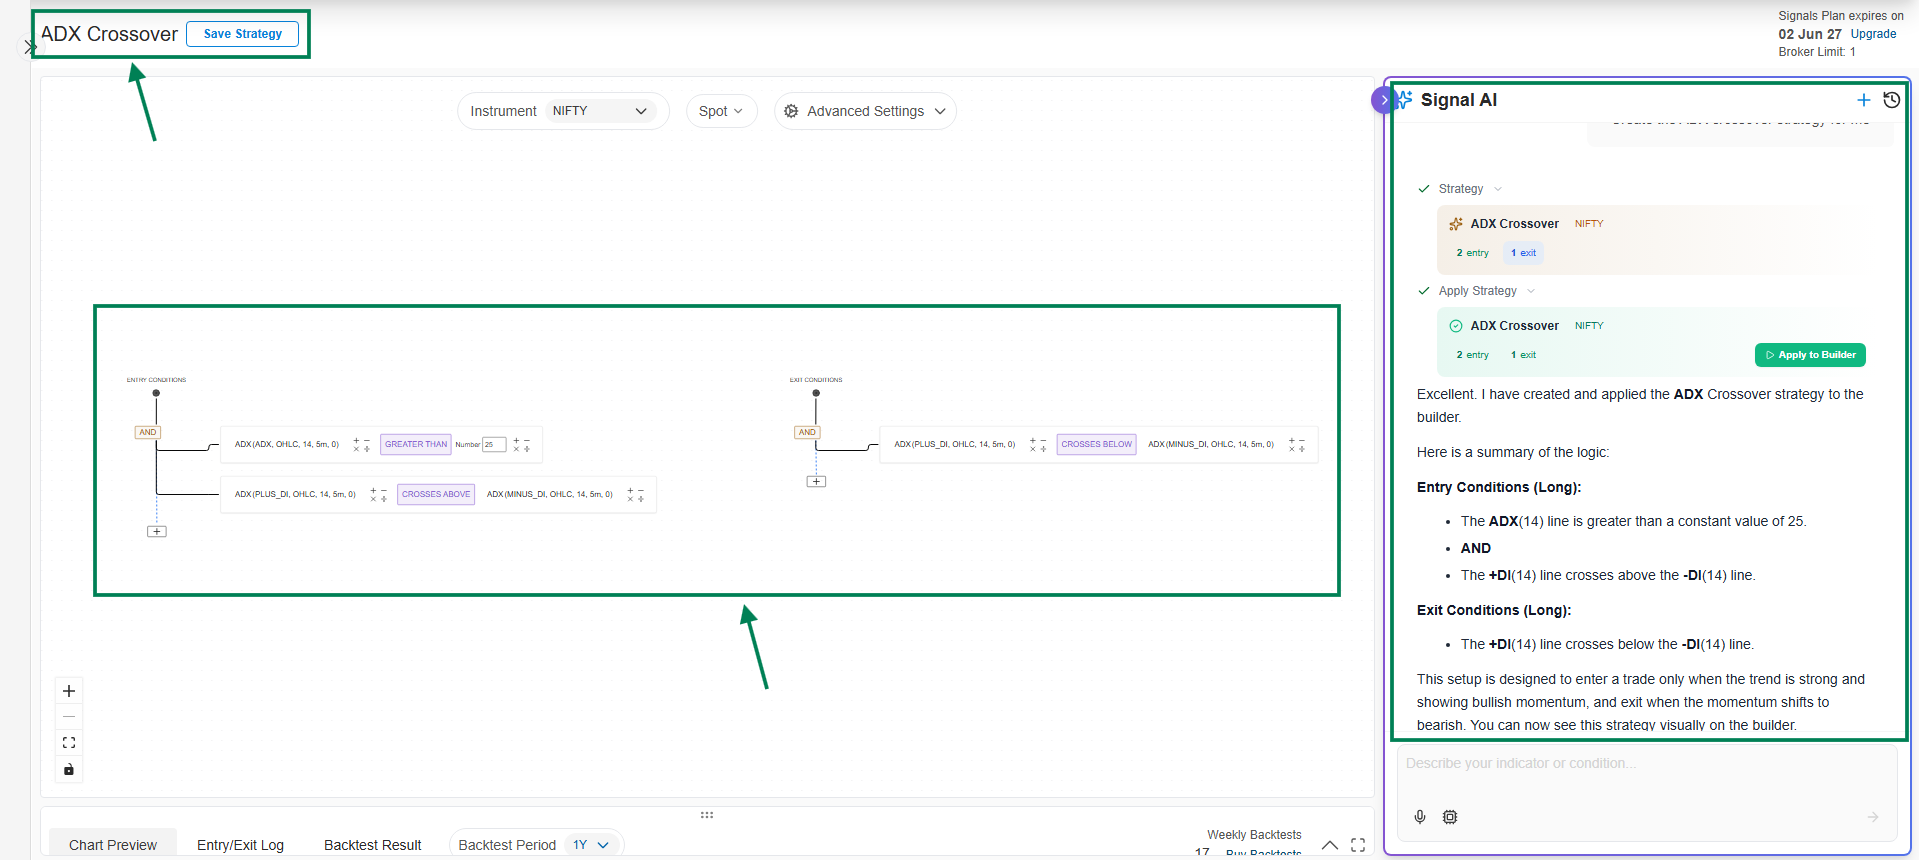
→ Here is the summary ADX Crossover Strategy:
Strategy: ADX Crossover Strategy
This strategy is configured to trade on NIFTY cash data using a 5-minute timeframe.
Entry Conditions
A long position is opened when both of the following conditions are met:
-
The ADX(14) line is greater than a constant value of 25.
-
The +DI(14) line crosses above the -DI(14) line.
Exit Conditions
The position is closed when:
- The +DI(14) line crosses below the -DI(14) line.
→ Trend Indicators
7. VWAP (Volume Weighted Average Price): VWAP is a technical analysis indicator used on intraday charts that resets at the start of each new trading day. It represents the average price of a security, adjusted for its trading volume.
The VWAP line serves as a benchmark for the current trading session. It is often used by institutional traders to identify fair value.
-
How it's calculated: It is calculated by taking the total value of all trading transactions (Price * Volume) and dividing it by the total volume traded for the day.
-
Why it's important: Unlike a simple moving average, VWAP gives more weight to price levels where heavier trading volume occurred. This makes it a more accurate representation of the "true" average price for the day.
-
Common Usage: Traders often use the VWAP line as a reference for support and resistance. A stock trading below the VWAP is often considered "undervalued" or bearish for the session, while a stock trading above it is considered "overvalued" or bullish.
Strategy Overview: VWAP Crossover
A popular and straightforward strategy using VWAP is the price crossover strategy, which is primarily used for intraday trading.
1. Bullish Signal (Long Entry):
-
Condition: The price of the asset CROSSES_ABOVE the VWAP line.
-
Interpretation: This suggests that momentum is shifting upwards and the asset is now trading at a premium for the day, indicating bullish strength.
2. Bearish Signal (Short Entry or Long Exit):
-
Condition: The price of the asset CROSSES_BELOW the VWAP line.
-
Interpretation: This indicates that the asset is now trading at a discount for the day. Momentum may be shifting downwards, signaling bearish weakness.
This strategy can be enhanced by adding other indicators like RSI or MACD to confirm the momentum before entering a trade.
Indicator Settings
The VWAP indicator itself has minimal settings, as it's calculated based on the day's price and volume data.
-
Source: This is the price data point from each candle used in the calculation. While the standard formula uses a typical price (High + Low + Close) / 3, you can often select other sources like:
-
CLOSE
-
OPEN
-
HIGH
-
LOW
-
-
Bands (Optional): While not a core part of the indicator, some platforms allow you to add standard deviation bands around the central VWAP line. These bands can function similarly to Bollinger Bands, helping to identify overbought or oversold conditions relative to the day's average price.
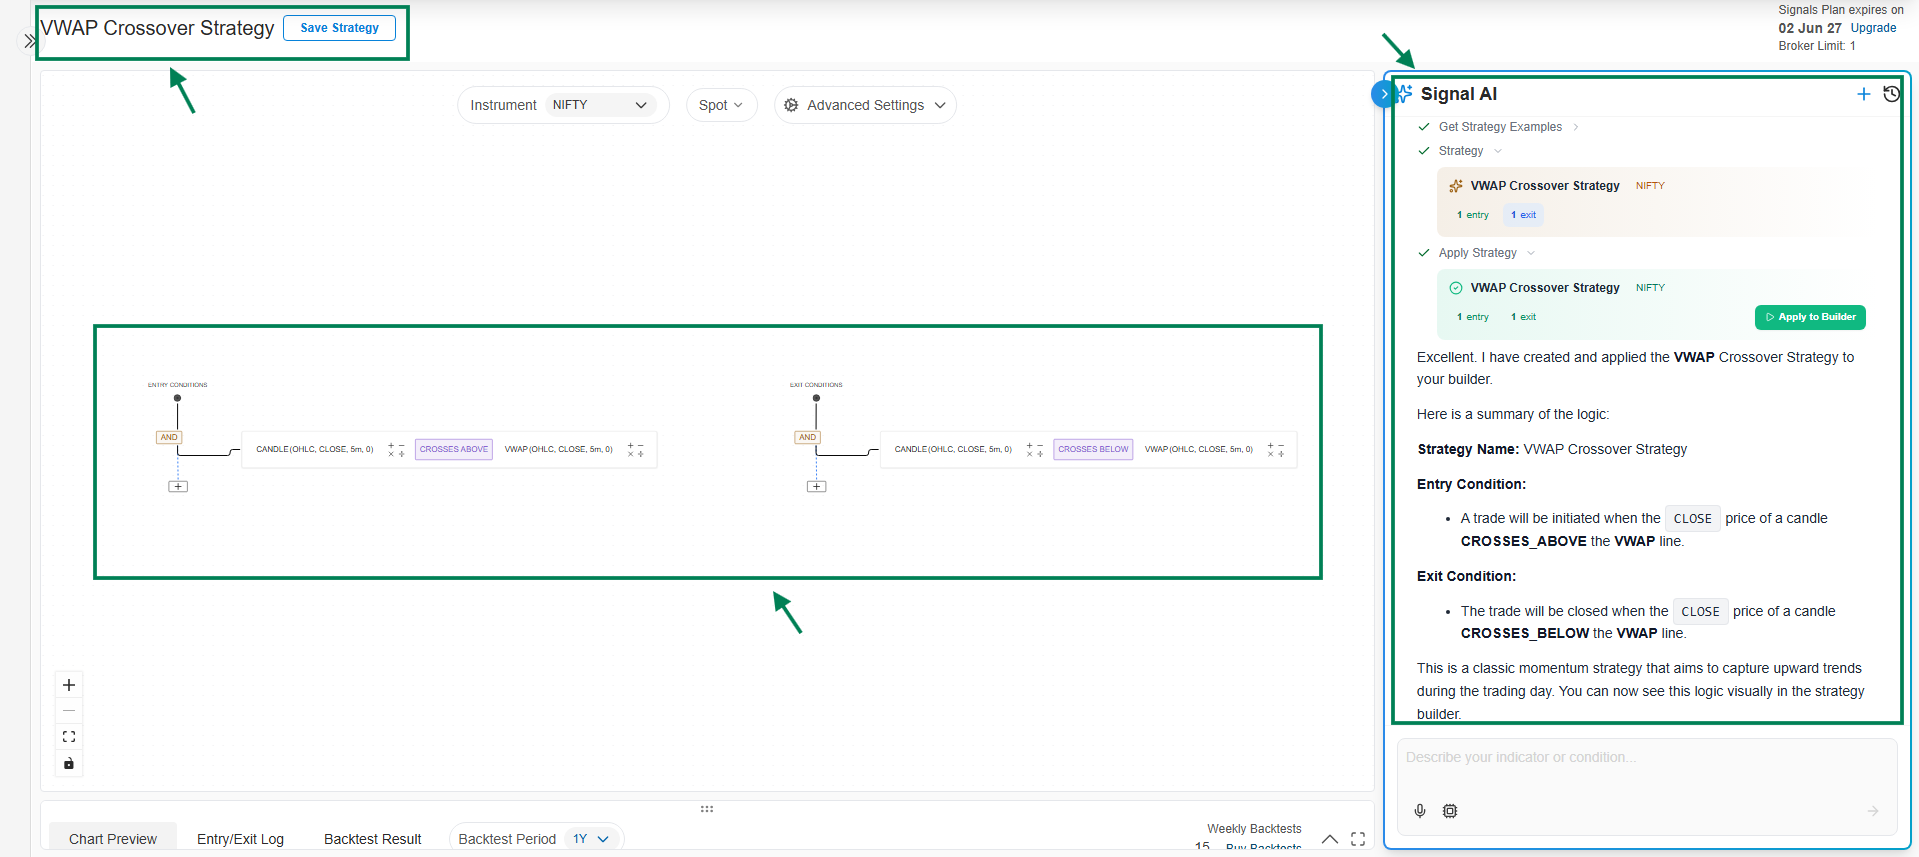
Here is a summary of the logic:
Strategy Name: VWAP Crossover Strategy
Entry Condition:
- A trade will be initiated when the CLOSE price of a candle CROSSES_ABOVE the VWAP line.
Exit Condition:
- The trade will be closed when the CLOSE price of a candle CROSSES_BELOW the VWAP line.
This is a classic momentum strategy that aims to capture upward trends during the trading day. You can now see this logic visually in the strategy builder.
\