Momentum Indicators
1. RSI Indicator Overview
The Relative Strength Index (RSI) is a momentum oscillator that measures the speed and change of price movements. It was developed by J. Welles Wilder and is one of the most popular technical indicators.
-
Function: The RSI oscillates between 0 and 100.
-
Interpretation: It helps traders identify overbought or oversold conditions in a market.
-
Overbought: An asset is considered overbought when the RSI is above a certain level, typically 70. This may signal a potential price correction or reversal.
-
Oversold: An asset is considered oversold when the RSI is below a certain level, typically 30. This may signal a potential price bounce or rally.
-
-
Divergence: RSI can also be used to spot divergence. For example, if the price is making a new high but the RSI is not, it could indicate weakening momentum.
RSI Strategy Overview
A common and straightforward strategy using the RSI is the RSI Crossover strategy.
-
Entry Condition (Buy): A buy signal is generated when the RSI crosses above the oversold level (e.g., 30). This suggests that the bearish momentum is fading and a potential price reversal to the upside is imminent.
-
Exit Condition (Sell): A sell signal is generated when the RSI crosses above the overbought level (e.g., 70). This indicates that the market may be due for a pullback, and it's a good time to exit the long position.
This logic can be inverted for a short-selling strategy.
Indicator Input Settings
To use the RSI indicator in a strategy, you need to configure its specific parameters. Here are the standard inputs:

| Parameter | Default Value | Description |
|---|---|---|
| period | 14 | The lookback period for the calculation. A shorter period makes the RSI more sensitive to price changes, while a longer period makes it smoother. |
| source | CLOSE | The price source to use for the calculation (e.g., OPEN, HIGH, LOW, CLOSE). |
candle_type | OHLC | The type of candle data to use (e.g., standard OHLC or HEIKIN_ASHI). |
→ Let’s build an RSI Crossover Strategy
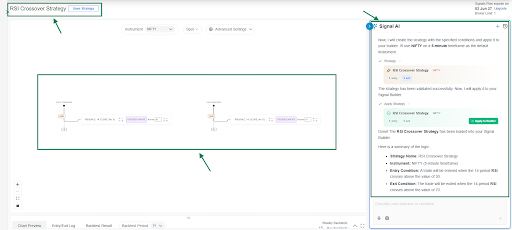
Here is a summary of the logic:
-
Strategy Name: RSI Crossover Strategy
-
Instrument: NIFTY (5-minute timeframe)
-
Entry Condition: A trade will be entered when the 14-period RSI crosses above the value of 30.
-
Exit Condition: The trade will be exited when the 14-period RSI crosses above the value of 70.
2. MACD Indicator Overview
The Moving Average Convergence Divergence (MACD) is a popular trend-following momentum indicator that shows the relationship between two Exponential Moving Averages (EMAs) of a security’s price.
It has three main components:
-
MACD Line: This is the core of the indicator. It's calculated by subtracting the 26-period EMA from the 12-period EMA. It represents the short-term momentum.
-
Signal Line: This is a 9-period EMA of the MACD Line itself. It acts as a trigger line, helping to identify buy and sell signals.
-
Histogram: This is the difference between the MACD Line and the Signal Line. It visually represents the distance between the two lines. When the histogram is positive (above zero), it indicates bullish momentum. When it's negative (below zero), it indicates bearish momentum.
MACD Crossover Strategy Overview
A very common and straightforward strategy using this indicator is the MACD Crossover.
-
Entry Condition (Buy Signal): A buy signal is generated when the MACD Line crosses above the Signal Line. This indicates that the momentum is shifting to the upside and a potential uptrend is beginning.
-
Exit Condition (Sell Signal): A sell signal is generated when the MACD Line crosses below the Signal Line. This suggests that the momentum is shifting to the downside and the uptrend may be ending.
Indicator Input Settings
Here are the standard input settings for the MACD indicator used on this platform:
| Parameter | Default value | Description |
|---|---|---|
| fast_period | 12 | The period for the faster Exponential Moving Average. |
slow_period | 26 | The period for the slower Exponential Moving Average. |
| signal_period | 9 | The period for the EMA of the MACD Line (the Signal Line). |
| source | CLOSE | The price source used for the calculations (e.g., CLOSE, OPEN). |
| macd_component | MACD_LINE | The specific output to use in a condition: MACD_LINE, SIGNAL_LINE, or HISTOGRAM. |
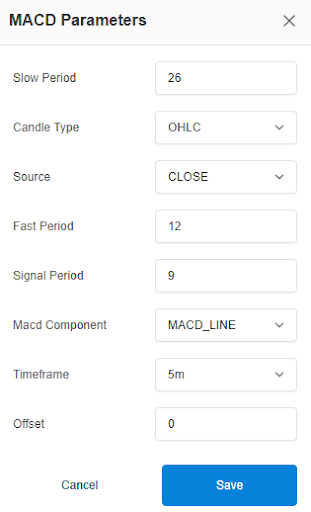
User Guide: MACD Indicator Input Settings
-
Candle Type (Dropdown):
Select the candle format for calculation
Example: OHLC / Heikin Ashi -
Source (Dropdown):
Choose the price type used for MACD calculation
Options include: Open, High, Low, Close, OHLC4, HLC3, HL2 -
Fast Period (Input Field):
Set the fast EMA period
Example: 12 -
Slow Period (Input Field):
Set the slow EMA period
Example: 26 -
Signal Period (Input Field):
Set the signal line period
Example: 9 -
MACD Component (Dropdown):
Select the MACD component to use in conditions
Options include: MACD Line, Signal Line, Histogram -
Timeframe (Dropdown):
Select the timeframe for the indicator
Example: 1m, 5m, 15m, 1H, etc. -
Offset (Optional):
Adjust the indicator forward/backward if required
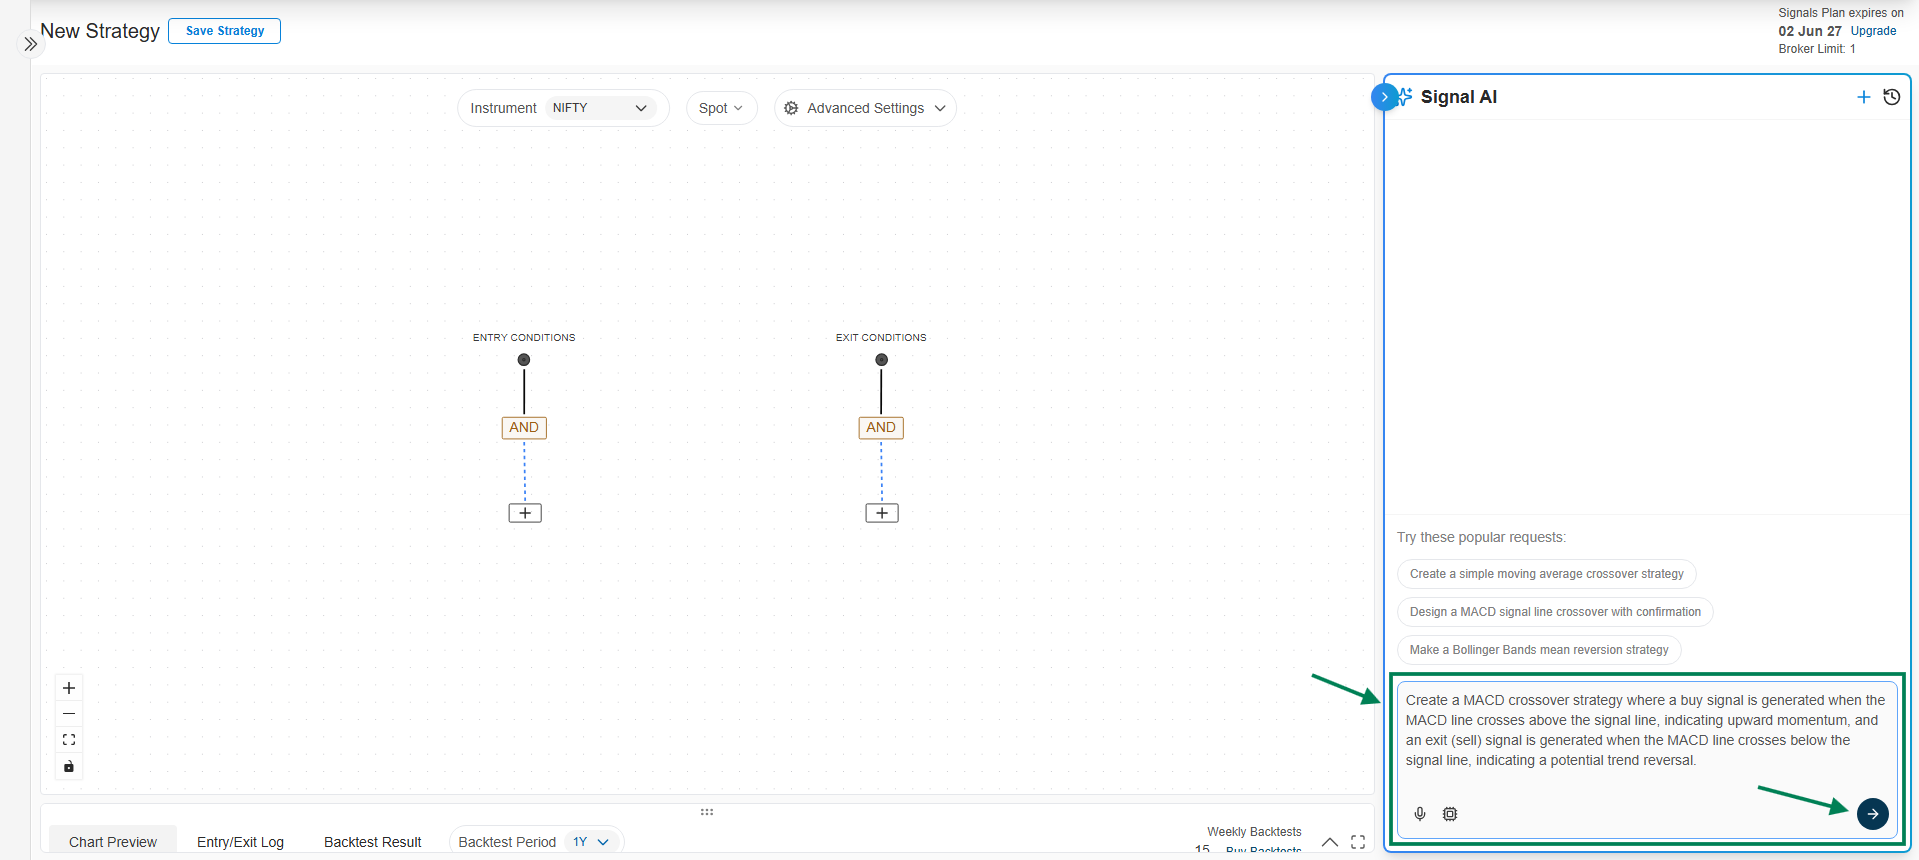
→ Let’s build a MACD crossover Indicator strategy
Strategy: Create a MACD crossover strategy where a buy signal is generated when the MACD line crosses above the signal line, indicating upward momentum, and an exit (sell) signal is generated when the MACD line crosses below the signal line, indicating a potential trend reversal.
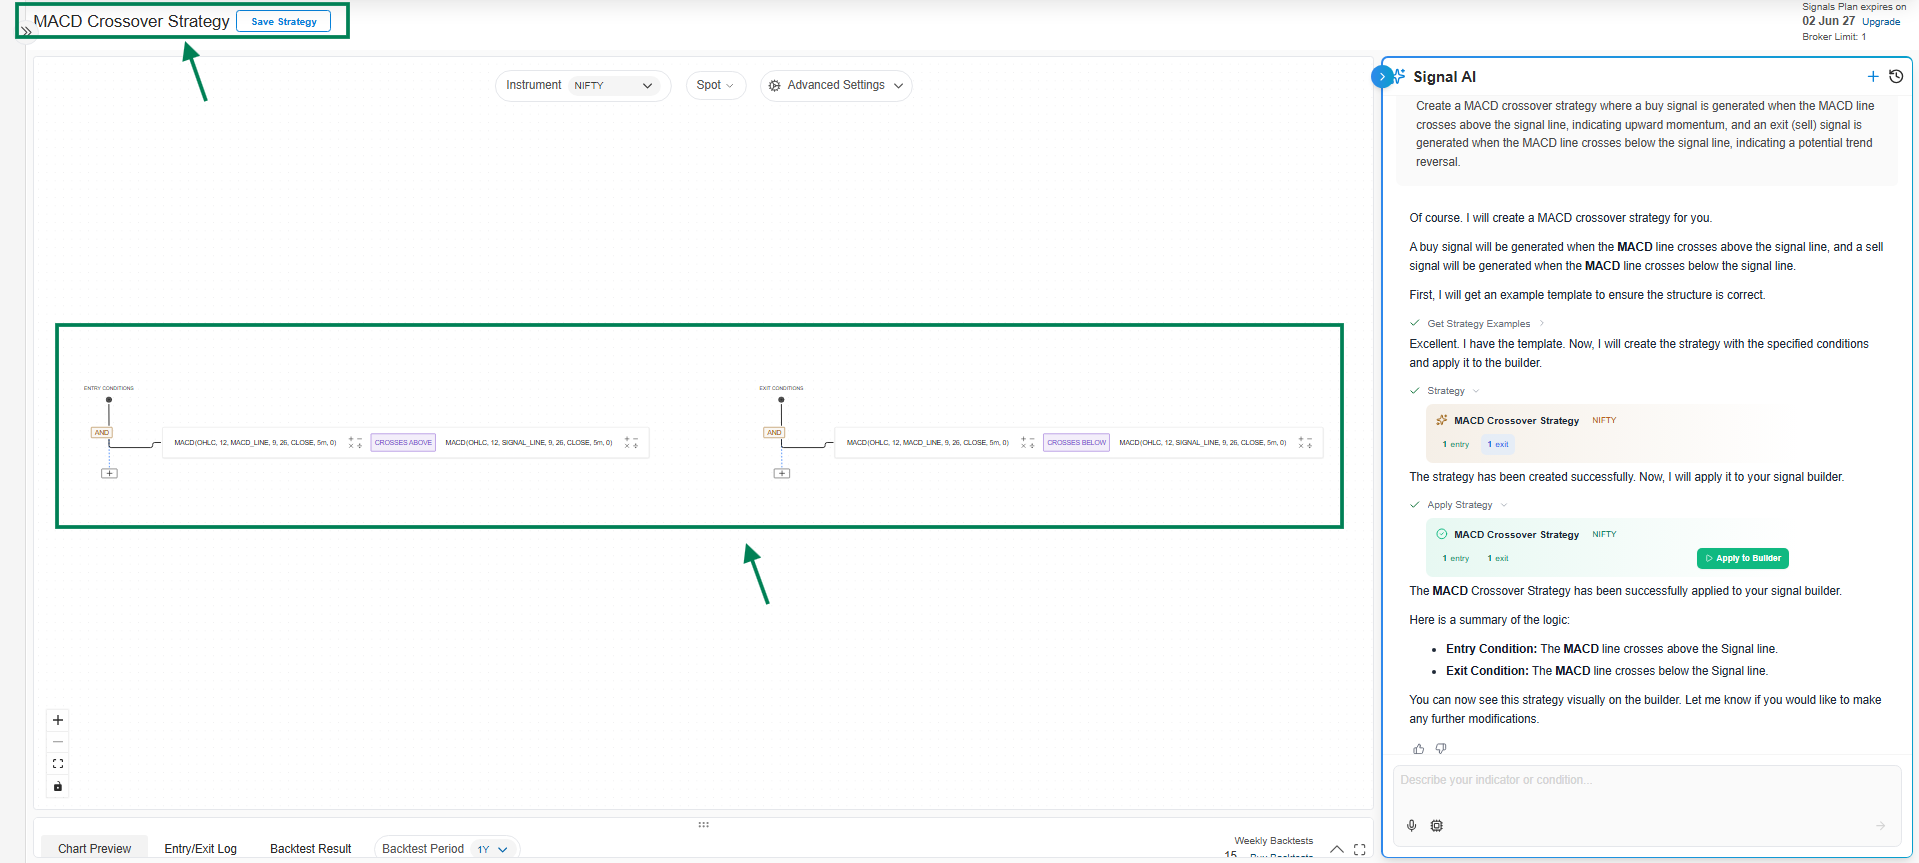
Here is a summary of the logic:
-
Entry Condition: The MACD line crosses above the Signal line.
-
Exit Condition: The MACD line crosses below the Signal line.
3. Stochastic Oscillator:
Stochastic Oscillator Indicator Overview
The Stochastic Oscillator is a momentum indicator that compares a particular closing price of an asset to a range of its prices over a certain period of time. The main idea is that momentum precedes price, so the oscillator can signal a potential price reversal before it happens.
It consists of two lines:
-
%K line: This is the main line, which measures the current price relative to its recent high-low range.
-
%D line: This is a moving average of the %K line, acting as a smoother signal line.
The indicator oscillates between 0 and 100.
-
Overbought: A reading above 80 is generally considered overbought.
-
Oversold: A reading below 20 is generally considered oversold.
2. Indicator Input Settings
The Stochastic Oscillator has two primary parameters:
| Parameter | Description | Default value |
|---|---|---|
| k_period | The look-back period for calculating the main %K line. | 14 |
| d_period | The smoothing period applied to the %K line to create the %D signal line. | 3 |
3. Strategy Overview
A common strategy using the Stochastic Oscillator is to look for crossovers of the %K and %D lines, especially when they occur in the overbought or oversold zones.
Bullish Signal (Potential Buy):
-
Condition: The Stochastic %K line crosses above the %D line.
-
Confirmation: This signal is considered stronger if the crossover happens when both lines are in the oversold area (below 20).
Bearish Signal (Potential Sell):
-
Condition: The Stochastic %K line crosses below the %D line.
-
Confirmation: This signal is considered stronger if the crossover happens when both lines are in the overbought area (above 80).
This strategy aims to identify when momentum is shifting, providing potential entry and exit points.
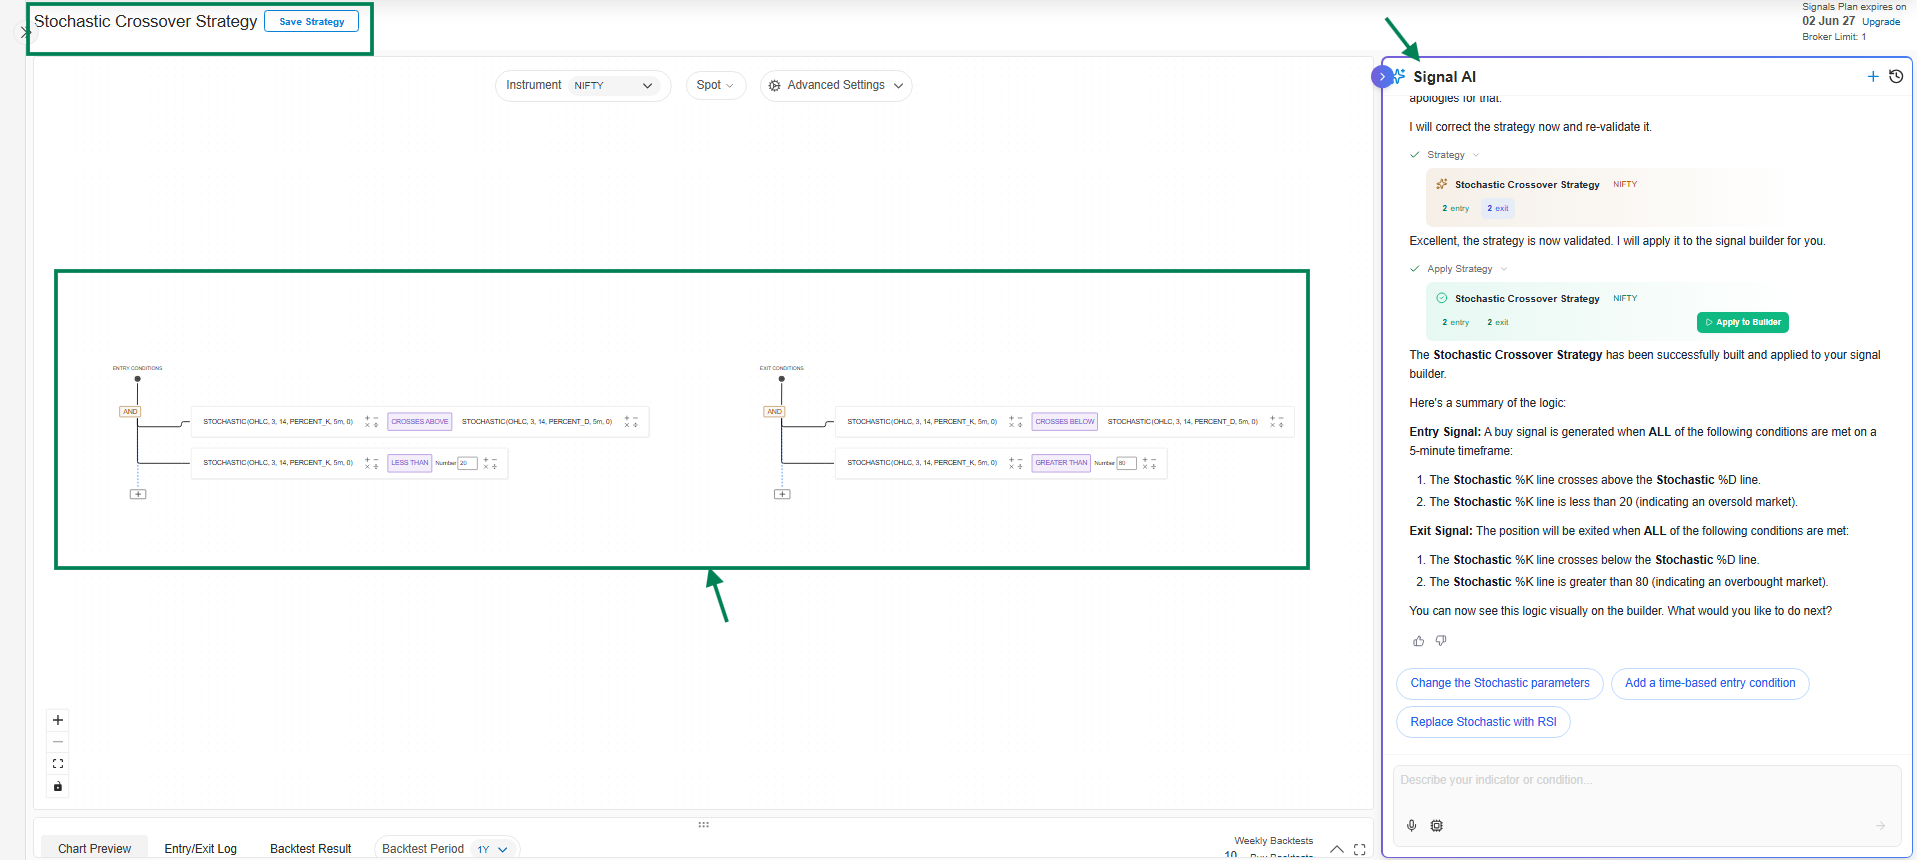
→ Here is the Stochastic Indicator Parameters in Signal AI:

User Guide: Stochastic Indicator Input Settings
-
Candle Type (Dropdown):
Select the candle format for calculation
Example: OHLC / Heikin Ashi -
K Period (Input Field):
Set the lookback period for %K
Example: 14 -
D Period (Input Field):
Set the smoothing period for %D
Example: 3 -
Stochastic Line (Dropdown):
Select the component to use in conditions
Options include: %K, %D -
Timeframe (Dropdown):
Select the timeframe for the indicator
Example: 1m, 5m, 15m, 1H, etc. -
Offset (Optional):
Adjust the indicator forward/backward if required
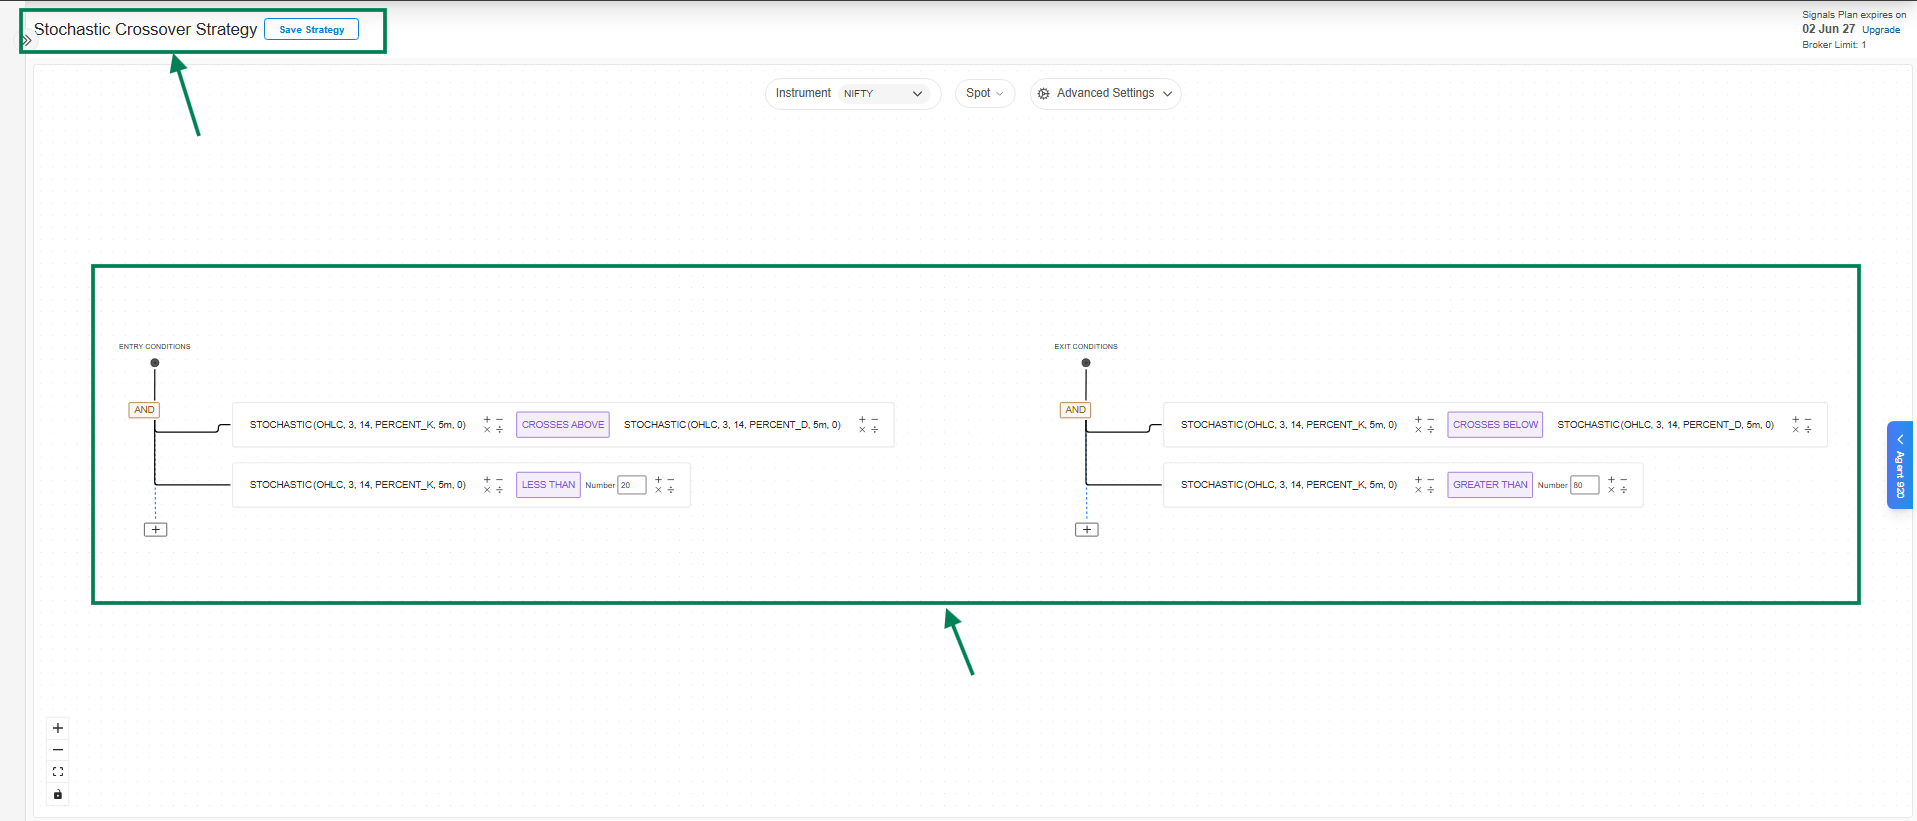
→ Let’s build Stochastic Indicator based strategy:
4. ROC Indicator
→ ROC Indicator Overview
The Rate of Change (ROC) is a momentum oscillator. It measures the percentage change in price between the current price and the price a certain number of periods ago.
-
How it works: It calculates ((Current Price - Price N periods ago) / Price N periods ago) * 100.
-
What it shows: The ROC plots as a line that oscillates above and below a zero line.
-
Above Zero: When ROC is positive, it indicates upward or bullish momentum.
-
Below Zero: When ROC is negative, it indicates downward or bearish momentum.
-
Zero Crossover: When the ROC line crosses the zero line, it can signal a potential trend change.
-
It is primarily used to identify the strength of a trend and spot potential reversals.
→ Strategy Overview: Zero-Line Crossover
A popular and straightforward strategy using the ROC indicator is the "Zero-Line Crossover."
-
Buy Signal (Entry): A buy signal is generated when the ROC value crosses above the zero line. This suggests that the price is gaining upward momentum and a new uptrend might be starting.
-
Sell Signal (Exit): A sell signal is generated when the ROC value crosses below the zero line. This indicates that momentum is shifting to the downside and the uptrend may be ending.
This strategy aims to capture the beginning of a new trend by identifying when momentum shifts from negative to positive or vice-versa.
→ Indicator Input Settings
To use the ROC indicator in the AlgoTest signal builder, you will need to configure the following parameters:
| Parameter | Description | Default Value |
|---|---|---|
| Period | The lookback period used for the calculation. | 14 |
| Source | The price source to use (e.g., OPEN, HIGH, LOW, CLOSE). | CLOSE |
| candle_type | The type of candle for the calculation. | OHLC |

User Guide: ROC Indicator Parameters
-
Candle Type (Dropdown):
Select the candle format for calculation
Example: OHLC / Heikin Ashi -
Source (Dropdown):
Choose the price type used for SMA calculation
Options include: Open, High, Low, Close, OHLC4, HLC3, HL2 -
Period (Input Field):
Set the SMA period
Example: 20 (SMA 20), 50 (SMA 50) -
Timeframe (Dropdown):
Select the timeframe for the indicator
Example: 1m, 5m, 15m, 1H, etc. -
Offset (Optional):
Adjust the SMA forward/backward if required
Use these settings to configure SMA before applying it to your strategy conditions.
These settings allow you to customize the indicator's sensitivity to price changes. A shorter period will make it more responsive to recent price action, while a longer period will produce a smoother line.
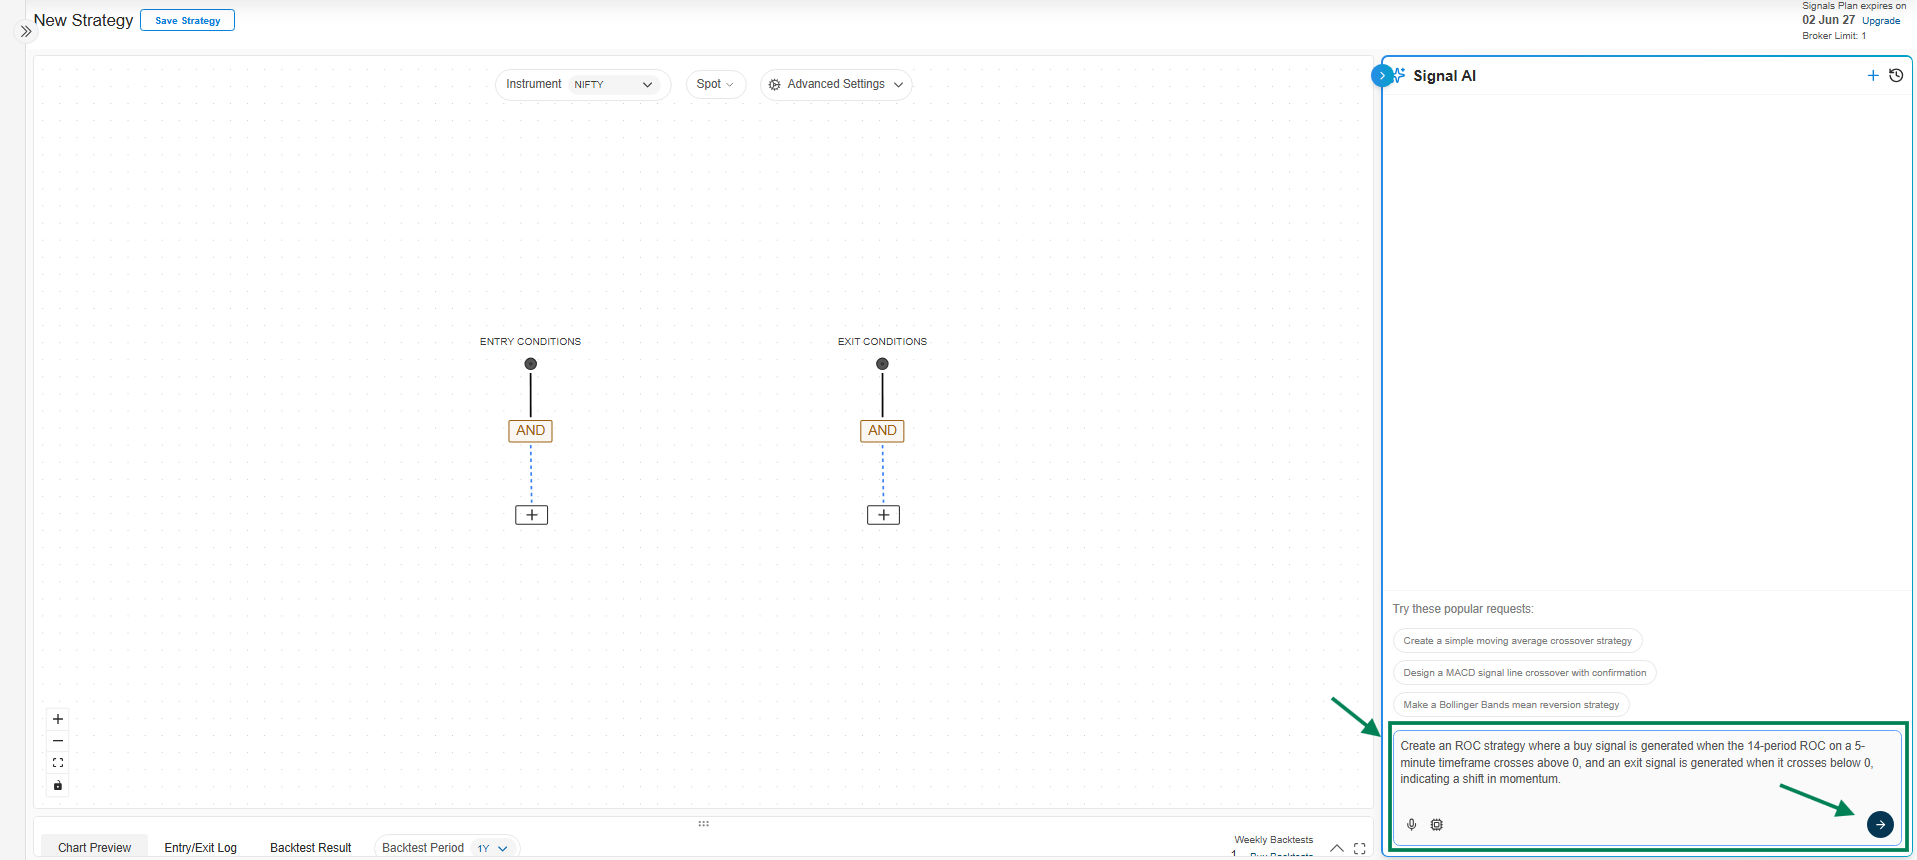
**→ Let’s build Simple ROC Indicator based strategy: **
Signal AI Prompt: Create an ROC strategy where a buy signal is generated when the 14-period ROC on a 5-minute timeframe crosses above 0, and an exit signal is generated when it crosses below 0, indicating a shift in momentum.
→ Here is the ROC Indicator based Strategy
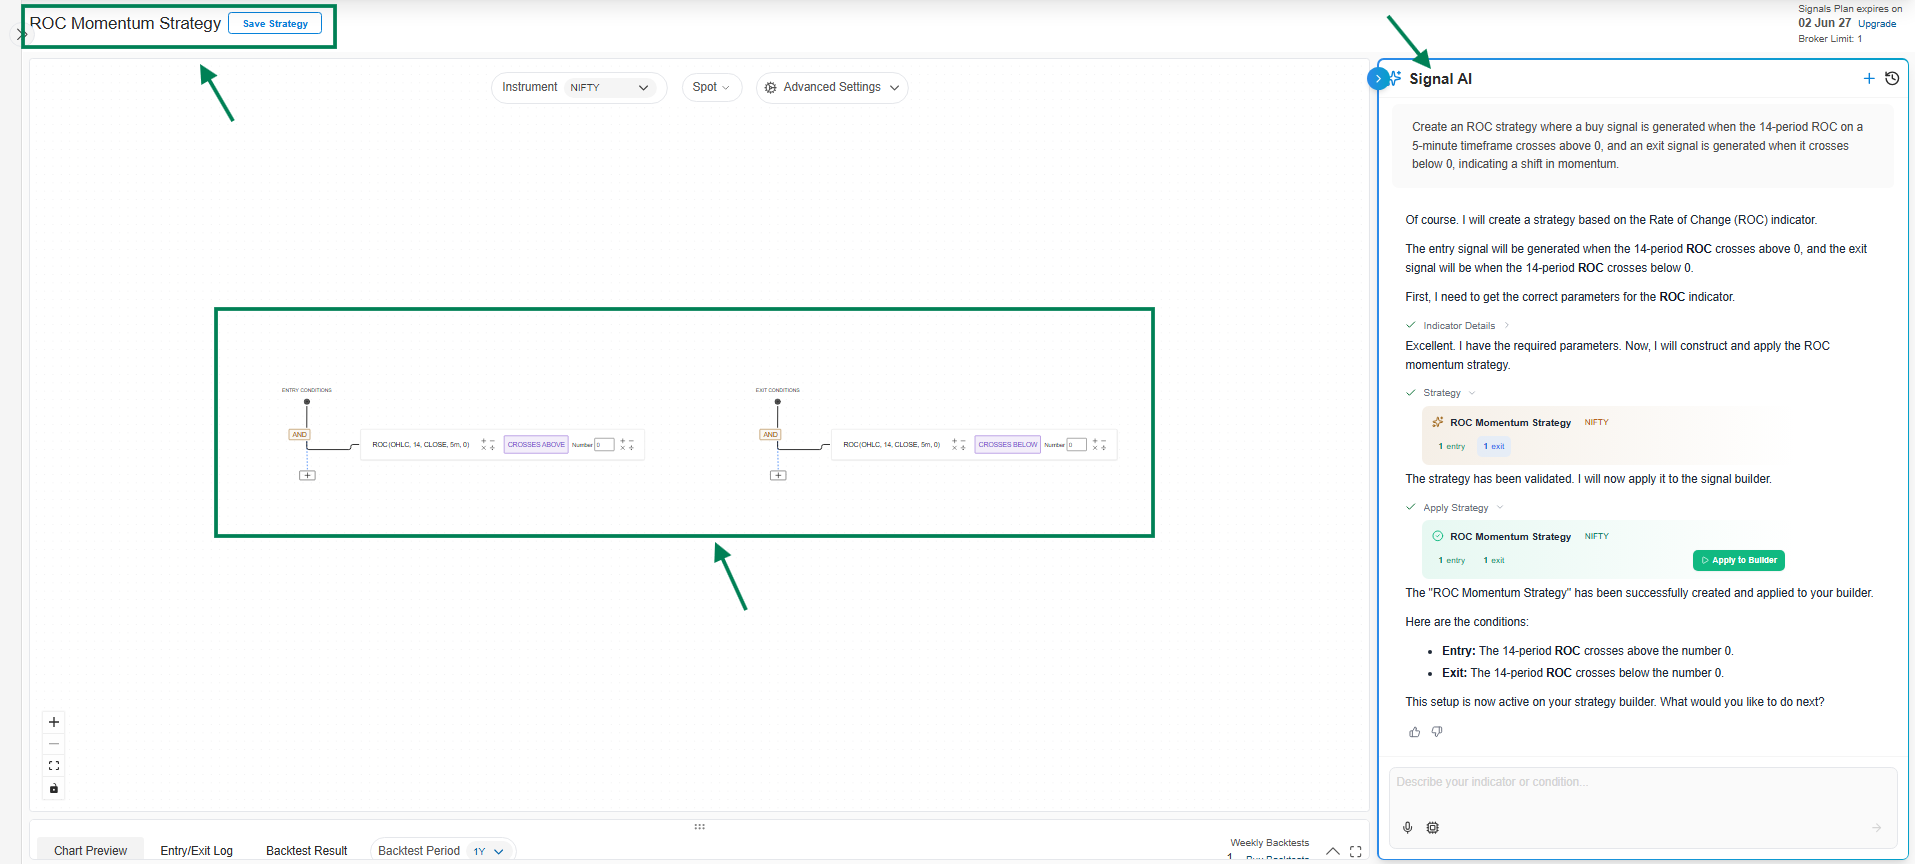
Here is a summary of ROC Indicator based strategy:
Entry Condition:
A buy signal is generated when:
- The 14-period Rate of Change (ROC) crosses above the number 0.
Exit Condition:
An exit signal is generated when:
- The 14-period Rate of Change (ROC) crosses below the number 0.
In short, the strategy aims to enter a long position when momentum turns positive and exit when it turns negative.
5.Williams %R:
Williams %R Indicator Overview
The Williams %R (or Williams Percent Range) is a momentum indicator that moves between 0 and -100. Its primary purpose is to identify overbought and oversold conditions in the market.
-
Overbought: When the indicator shows a value between -20 and 0, it suggests that the price is trading near the top of its recent high-low range, and a reversal or pullback might be imminent.
-
Oversold: When the indicator shows a value between -80 and -100, it suggests the price is trading near the bottom of its recent range, and a bounce or rally could be on the horizon.
It is similar to the Stochastic Oscillator but is plotted on a negative scale.
Indicator Strategy Overview
A common strategy using Williams %R is to look for the indicator to move out of the overbought or oversold zones, which can signal a shift in momentum.
-
Buy Signal (Long Entry): A potential buy signal occurs when the Williams %R crosses above the -80 level from below. This indicates that the asset is moving out of the oversold territory and buying pressure may be increasing.
-
Sell Signal (Short Entry): A potential sell signal occurs when the Williams %R crosses below the -20 level from above. This suggests the asset is leaving the overbought territory and selling pressure may be starting to build.
Indicator Input Settings
The primary input setting for the Williams %R indicator is:
-
Period: This is the lookback period used to calculate the indicator. The default value is typically 14.
-
A shorter period (e.g., 7) will make the indicator more sensitive to price changes, resulting in more frequent signals.
-
A longer period (e.g., 21) will make it less sensitive, resulting in fewer, but potentially more reliable, signals.
-
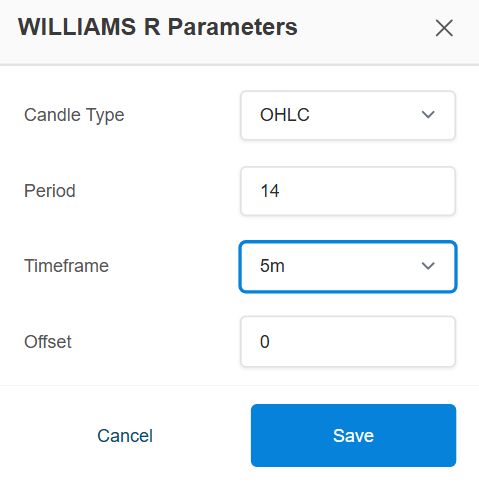
User Guide: Williams %R Indicator Input Settings
-
Candle Type (Dropdown):
Select the candle format for calculation
Example: OHLC / Heikin Ashi -
Period (Input Field):
Set the Williams %R period
Example: 14 -
Timeframe (Dropdown):
Select the timeframe for the indicator
Example: 5m, 15m, 1H, etc. -
Offset (Optional):
Adjust the indicator forward/backward if required
Use these settings to configure Williams %R before applying it to your strategy conditions.
→ Lets build Williams %R Indicator based Strategy using Signal AI
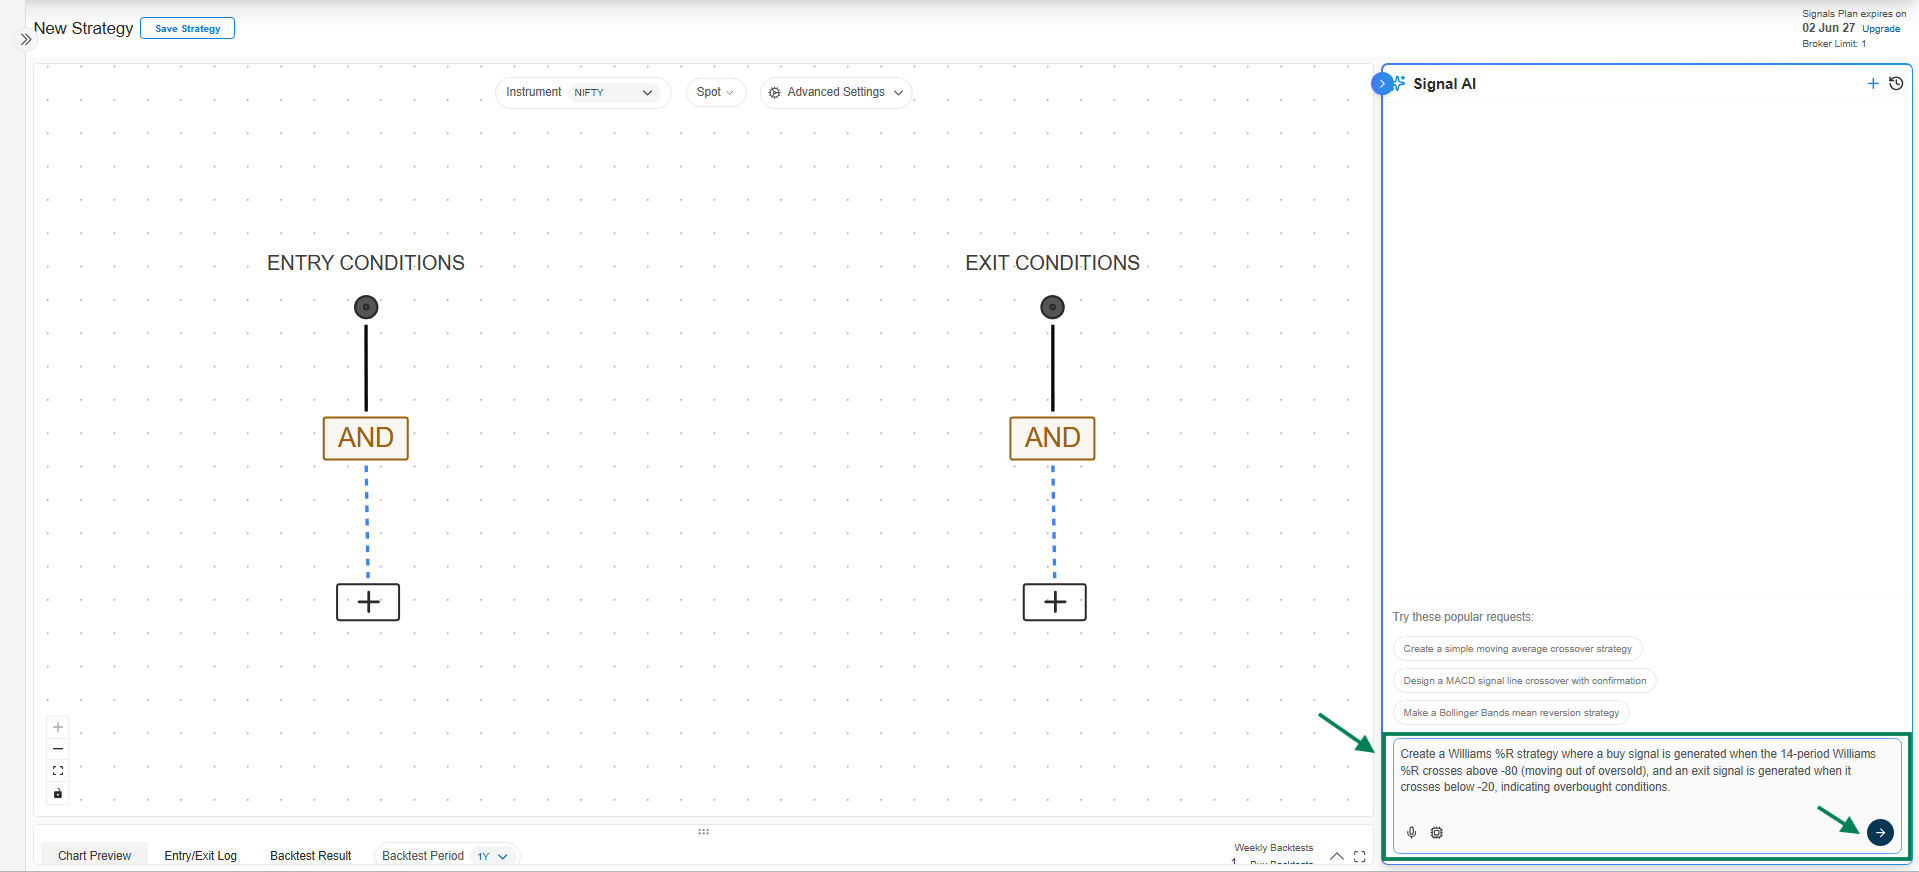
→ Here’s Williams %R Indicator Strategy on Canvas
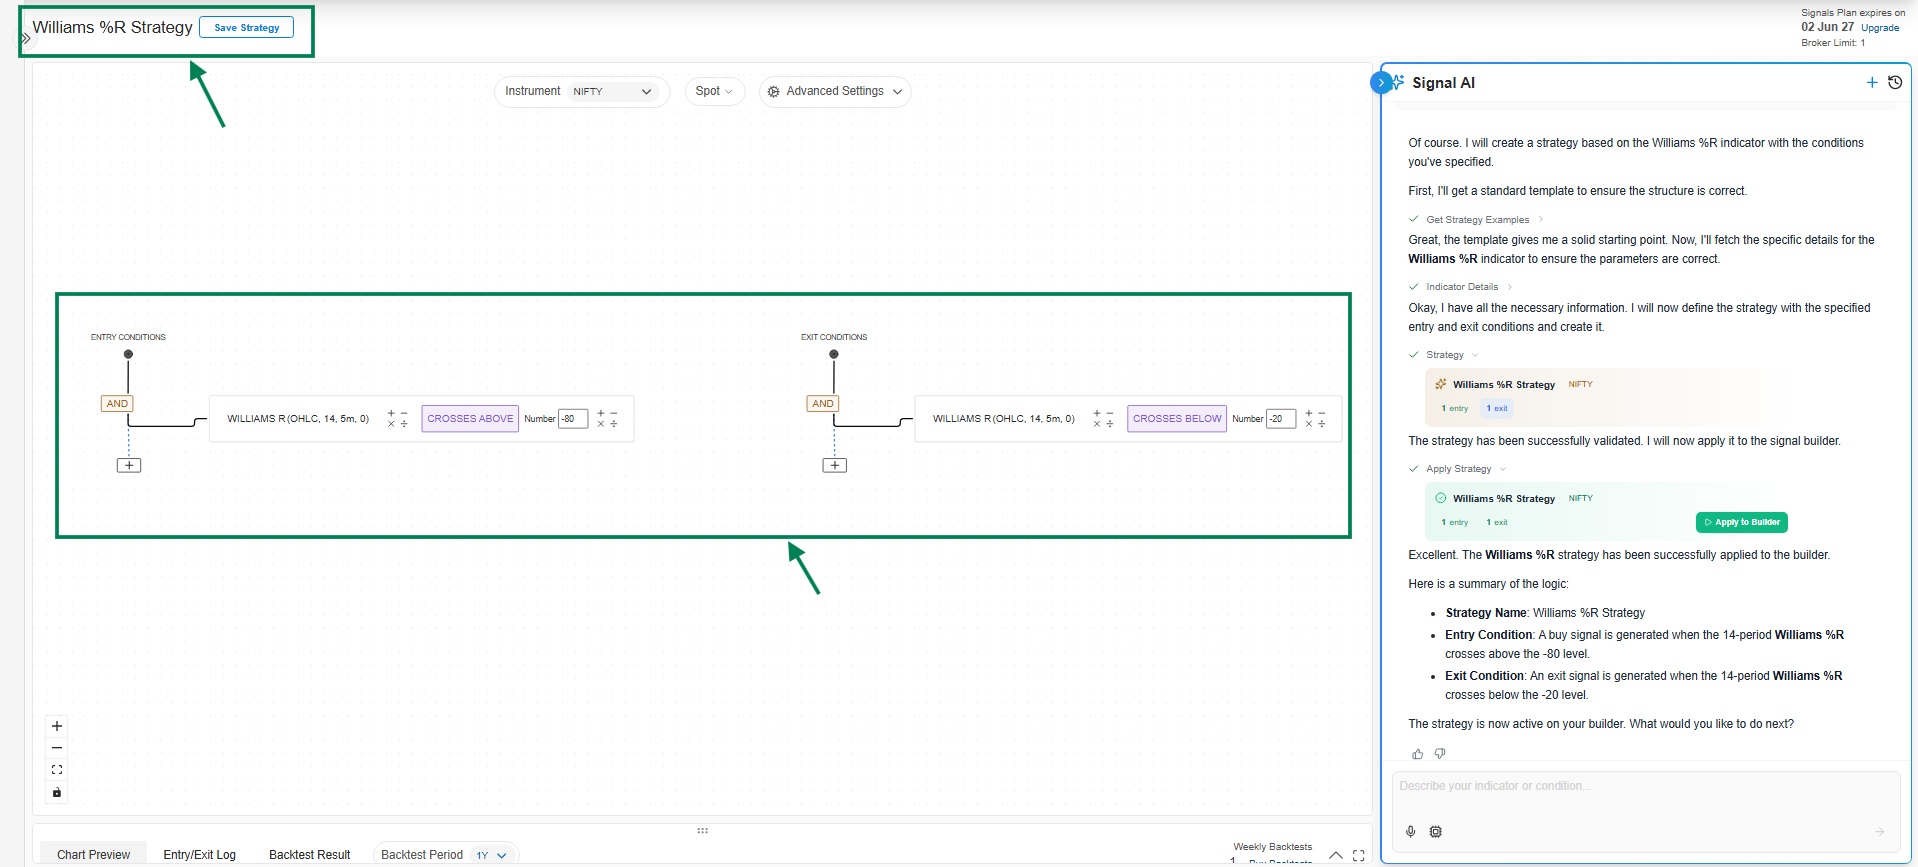
Entry Condition:
The strategy will generate an entry signal when:
- The 14-period Williams %R indicator crosses above the -80 level.
Exit Condition:
The strategy will generate an exit signal when:
- The 14-period Williams %R indicator crosses below the -20 level.
This is a classic mean-reversion strategy that aims to buy when the instrument is oversold (crossing above -80) and sell when it becomes overbought (crossing below -20).\
6. Special K: The Special K indicator, developed by Martin Pring, is a momentum oscillator that combines short, intermediate, and long-term rate-of-change (ROC) calculations. This blend of different timeframes makes it a sensitive and comprehensive tool for identifying primary trend changes.
Indicator Overview
-
Purpose: To identify major trend reversals by smoothing out short-term price fluctuations and focusing on the underlying market momentum.
-
How it Works: It is calculated by summing up multiple Rate of Change (ROC) indicators with different lookback periods, which are then smoothed by moving averages. A signal line, which is a moving average of the Special K line itself, is often used to generate trading signals.
-
Interpretation:
-
Trend Direction: When the Special K line is rising, it indicates bullish momentum. When it's falling, it suggests bearish momentum.
-
Crossovers: A common signal is generated when the Special K line crosses above its signal line (a bullish sign) or below it (a bearish sign).
-
Divergence: Divergence between the indicator and the price can be a powerful signal of a potential trend reversal.
-
Strategy Example: Special K Crossover
A straightforward strategy is to use the crossover between the Special K line and its signal line.
-
Entry Condition:
- Buy when the Special K line crosses above its Simple Moving Average (SMA) signal line. This suggests that momentum is shifting to the upside.
-
Exit Condition:
- Sell when the Special K line crosses below its SMA signal line. This indicates that the bullish momentum is fading.
Indicator Parameters
To use the Special K indicator, you need to configure the following parameters, which control the different Rate of Change periods and the smoothing moving averages:
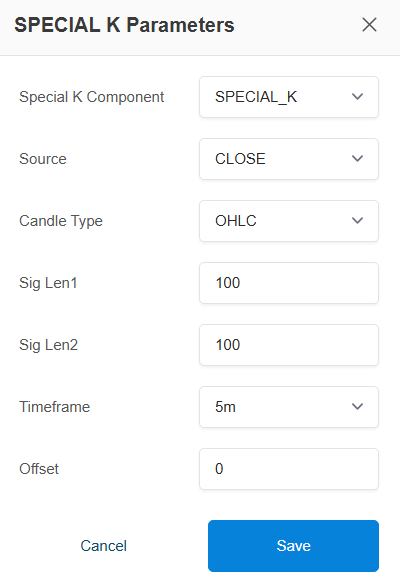
→ Indicator Parameters (Special K):
-
Special K Component: Select the indicator component (e.g., SPECIAL_K, )

Special K Component – Options:-
SPECIAL_K:
This is the main indicator line. It represents overall market momentum and helps identify trend direction and strength. Use this for primary signal generation. -
SIGNAL_LINE:
This is a smoothed version of the Special K line. It is mainly used for confirmation. When SPECIAL_K crosses above/below the SIGNAL_LINE, it can indicate potential buy/sell signals.
Indicator Parameters (Special K) – Explanation:
-
Special K Component: Defines which part of the Special K indicator is used. Typically kept as SPECIAL_K for standard momentum calculation.
-
Source: The price data used for calculation (e.g., Close is most common as it reflects final price consensus).
-
Candle Type: Determines how price data is considered (e.g., OHLC uses Open, High, Low, Close for better accuracy).
-
Sig Len1: Primary lookback period that controls how sensitive the indicator is to price changes. Lower value = faster signals, higher value = smoother signals.
-
Sig Len2: Secondary smoothing period used to filter noise and confirm trend strength. Higher value = more stable but slower signals.
-
Timeframe: Defines the chart interval (e.g., 5m). Lower timeframe = more signals, higher timeframe = stronger trends.
-
Offset: Shifts the indicator forward or backward on the chart (usually kept at 0 unless needed for alignment).
\
7. Bollinger Bands
→ Bollinger Bands Indicator Overview
Bollinger Bands are a volatility indicator created by John Bollinger. They consist of three main components that are plotted in relation to an asset's price:
-
Middle Band: A Simple Moving Average (SMA) of the asset's price (typically over a 20-period).
-
Upper Band: The Middle Band plus a certain number of standard deviations (usually 2) of the price data.
-
Lower Band: The Middle Band minus the same number of standard deviations.
The bands automatically widen when market volatility is high and narrow when volatility is low. This dynamic nature makes them a powerful tool for traders to identify potential overbought or oversold conditions and to gauge the strength of a trend.
→ Bollinger Bands Strategy Overview
A popular strategy using Bollinger Bands is the breakout strategy, which aims to capture strong price movements.
-
Buy Signal (Long Entry): A buy signal is generated when the asset's price crosses and closes above the Upper Band. This suggests that the price is breaking out of its recent trading range with strong upward momentum, potentially starting a new uptrend.
-
Sell Signal (Short Entry): A sell signal is generated when the price crosses and closes below the Lower Band. This indicates a downside breakout with significant selling pressure, potentially signalling the start of a new downtrend.
This strategy works best in trending markets. For sideways or ranging markets, a "mean reversion" strategy (buying at the lower band and selling at the upper band) is often preferred.
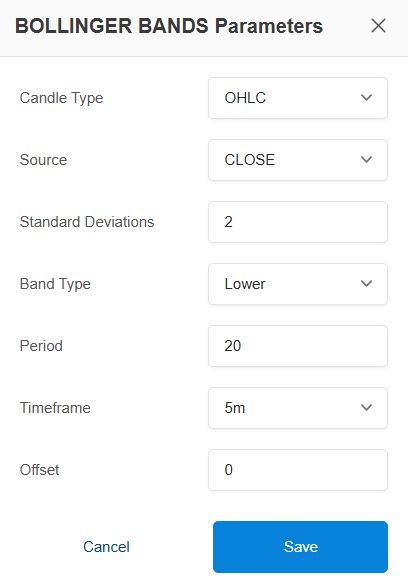
→ Here are the Bollinger Bands Parameters
\

This determines the type of candles used for the calculation. The default is OHLC, but you can also use HEIKIN_ASHI candles, which can help in smoothing out the price action to better identify trends.
→ Source (Dropdown):
Choose the price type used for Bollinger Bands calculation
Options include: Open, High, Low, Close, OHLC4, HLC3, HL2→ Standard Deviations

-
Decides how wide the bands are
-
2 = default setting
-
Higher → wider bands (less signals)
-
Lower → tighter bands (more signals)
-
→ Band Type

-
Select the Band Type based on Strategy Requirement: Upper Band, Lower Band, Middle Band
- Lower Band
-
This is the bottom line of the Bollinger Bands
-
Price reaching here means the market may be oversold
-
Often used for buy signals
-
Example: If price touches or goes below → possible bounce up
Upper Band
-
This is the top line of the Bollinger Bands
-
Price reaching here means the market may be overbought
-
Often used for sell signals
-
Example: If price touches or goes above → possible reversal down
Middle Band
This is the moving average (usually 20 EMA/SMA)
Acts like a trend indicator
Used for:
-
Identifying trend direction
-
Dynamic support/resistance
Example:
-
Price above middle band → uptrend
-
Price below middle band → downtrend
→ Period: 20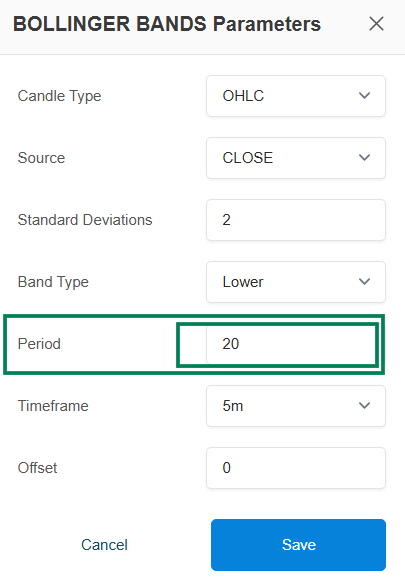
Uses last 20 candles for calculation -
Standard setting for most strategies
-
A shorter period (e.g., 10, 20) makes the Indicator react more quickly to price changes, tracking it more closely.
-
A longer period (e.g., 50, 200) makes the Indicator smoother and less sensitive to short-term price fluctuations.
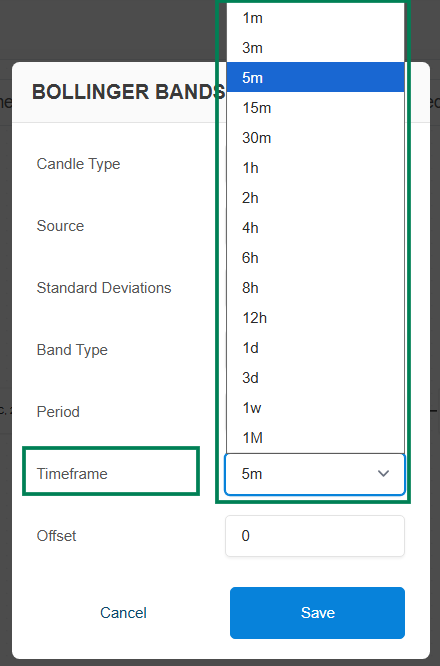
→ Timeframe : The chart interval for the indicator's data.
→ Offset: The Offset setting allows you to look back at an indicator's value from a previous candle. It's like asking, "What was the value of this indicator N candles ago?"
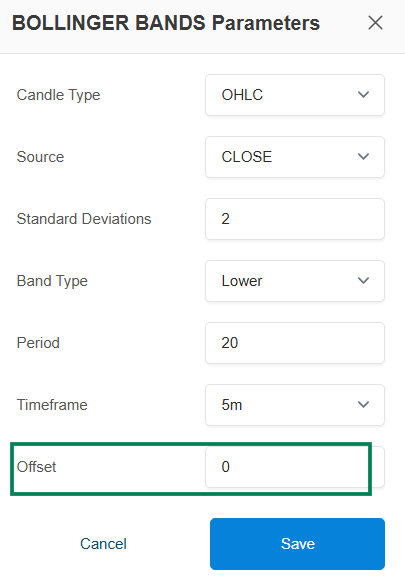
-
offset: 0: Refers to the current, still-forming candle.
-
offset: 1: Refers to the most recently completed candle (the previous candle).
-
offset: 2: Refers to the candle before the previous one, and so on.
8. ATR (Average True Range)\
ATR Indicator Overview
The Average True Range (ATR) is a technical analysis indicator that measures market volatility. It was developed by J. Welles Wilder Jr. and shows how much an asset's price has moved on average over a given period.
Key Characteristics:
-
Volatility, Not Direction: ATR purely measures volatility. A high ATR indicates high volatility, and a low ATR indicates low volatility. It does not tell you the direction of the trend.
-
Trailing Stops: Its most common use is to set dynamic, volatility-adjusted stop-loss orders. A "trailing stop" based on ATR can adapt to changing market conditions, becoming wider during volatile periods and tighter during calm periods.
-
Position Sizing: Traders also use ATR to determine position size. In a highly volatile market (high ATR), a trader might use a smaller position size to manage risk, and vice-versa.
Example ATR Indicator Strategy
A classic way to use ATR is for a Trailing Stop-Loss. This strategy helps you stay in a profitable trade as long as it's trending but gets you out if the price reverses by an unusual amount.
Here is a simple trend-following strategy using a Simple Moving Average (SMA) for entry and ATR for the exit.
-
Entry Condition:
- Enter a long position when the CLOSE price crosses above the 20-period SMA. This signals the start of a potential uptrend.
-
Exit Condition (ATR Trailing Stop):
-
Exit the position when the CLOSE price crosses below the value of (SMA - 2 * ATR).
-
This places a stop-loss at a distance of two times the ATR value below the 20-period SMA, which trails the price as it moves up.
-
ATR Indicator Input Settings
The ATR indicator has one primary input setting, which I've retrieved for you.
Indicator Details
The primary input setting for the ATR indicator is:
-
Period: This is the lookback period used to calculate the average "true range."
-
Default Value: 14
-
Description: A shorter period (e.g., 5) will make the ATR respond to volatility changes more quickly, while a longer period (e.g., 20) will result in a smoother, less sensitive line. The 14-period setting is the most common.
-
**→ Here is the ATR Indicator Parameters: **

User Guide: ATR Indicator Input Settings
Period (Input Field):
** **Set the number of candles used to calculate ATR
Example: 14 (default), 10, 20Candle Type (Dropdown):
** **Select the candle format for calculation
Example: OHLC / Heikin AshiTimeframe (Dropdown):
** **Select the timeframe for the indicator
Example: 1m, 5m, 15m, 1H, etc.Offset (Optional):
** **Adjust the ATR value forward/backward if required→ Use these settings to measure market volatility and apply ATR for stop loss, target, or strategy conditions.
\
9. MIN_MAX Indicator Overview
\
The MIN_MAX indicator is a straightforward yet powerful tool used to identify the highest or lowest price of an asset over a specified lookback period.
-
Functionality: It calculates either the maximum (MAX) or minimum (MIN) value of a chosen price source (e.g., HIGH, LOW, CLOSE) over a set number of candles (period).
-
Use Case: It's commonly used to identify recent price extremes, which form dynamic support and resistance levels. This is the fundamental building block for creating "breakout" strategies. For example, you can track the highest high over the last 20 candles.
Example Strategy: Price Channel Breakout
A classic strategy using the MIN_MAX indicator is the price channel breakout. The logic is to enter a trade when the price breaks out of its recent trading range.
-
Buy Signal: Enter a long position when the CLOSE price of the current candle crosses above the MAX value of the HIGH price over the last 20 periods. This signals a potential start of an uptrend.
-
Sell Signal (Exit): Exit the long position when the CLOSE price of the current candle crosses below the MIN value of the LOW price over the last 10 periods. This indicates that the momentum has shifted downwards.
This indicator is highly effective for building strategies that capitalize on market volatility and breakouts.
**→ Here is the MIN_MAX Indicator Parameters Settings : **
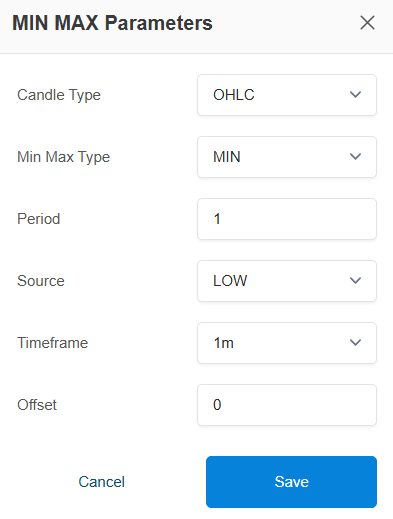
- Candle Type (Dropdown):
The type of candles to use for the price data.
Example: OHLC / Heikin Ashi
Min Max Type (Dropdown) : Specifies whether to calculate the minimum or maximum value.

Min Max Type is a setting that decides whether your condition is based on the lowest value (MIN) or the highest value (MAX) over a selected period.
Simple explanation:
MIN → Picks the lowest price/value in the given period
MAX → Picks the highest price/value in the given periodExample:
If Period = 10 candles:
-
MIN → Lowest low (or selected price type) from last 10 candles
-
MAX → Highest high (or selected price type) from last 10 candles
-
Period : The number of past candles to look back on for the calculation
Any integer (e.g., 20)
-
Source (Dropdown): The price data to use for the calculation.
Options include: Open, High, Low, Close, OHLC4, HLC3, HL2 -
Timeframe (Dropdown):
Select the timeframe for the indicator
Example: 1m, 5m, 15m, 1H, etc.\ -
Offset: The Offset setting allows you to look back at an indicator's value from a previous candle. It's like asking, "What was the value of this indicator N candles ago?"
-
offset: 0: Refers to the current, still-forming candle.
-
offset: 1: Refers to the most recently completed candle (the previous candle).
-
offset: 2: Refers to the candle before the previous one, and so on.
\
-
-